On Thursday, the EUR/USD currency pair once again traded relatively calmly, but the U.S. dollar failed to show any meaningful growth this time. A little bit of good news goes a long way. To recap, on Monday, there was no real reason for the dollar to fall, and on Tuesday and Wednesday, there was no reason for it to rise. The market is trading based on feelings, expectations, and perceptions. Naturally, we can't know why the market suddenly started buying the dollar.
However, the dollar's fairy tale lasted only three days. And as we've already said, even that rally shouldn't have happened. The reason is simple: U.S. macroeconomic data collapsed spectacularly. GDP shrank by 0.3% in Q1 — worse than any forecast — and ADP job creation came in at half the expected level. Earlier in the week, the JOLTS report was also disappointing. That's three out of three weak reports. So why would the dollar rise, especially when the Eurozone GDP report was twice as strong as expected?
Things began to fall into place on Thursday, and Friday presents a new test for the U.S. currency. Today, the U.S. will publish its NonFarm Payrolls and unemployment rate reports, and we have little doubt they'll come in significantly below expectations. Of course, that's just our assumption — but a sharp economic slowdown in Q1 compared to Q4 must be reflected in the labor market data. As such, these two critical reports may trigger another dollar collapse today.
Let's not forget that the dollar had legitimate reasons to rise in the past 2–3 months. The market feared the worst after Trump announced a global trade war — and those fears proved accurate. However, we should also remember that while the European Central Bank has been cutting rates non-stop, the Federal Reserve has not eased policy even once in 2025. That's not an insignificant factor. Yet, the market has ignored this and many other relevant inputs over the past two months. And now, it seems the dollar has no reason to rise because we already know the list of things the market is ignoring.
The trade war shows no signs of ending. Trump's "discounts" and "concessions" haven't impressed anyone. And the decline of the U.S. economy has gone from "anticipated" to "in progress." So, even though the pair has consolidated below the moving average line, it's now extremely difficult to believe in any real dollar strength. That said, the worst may already be priced in, meaning the dollar could still bounce. But probably not today.
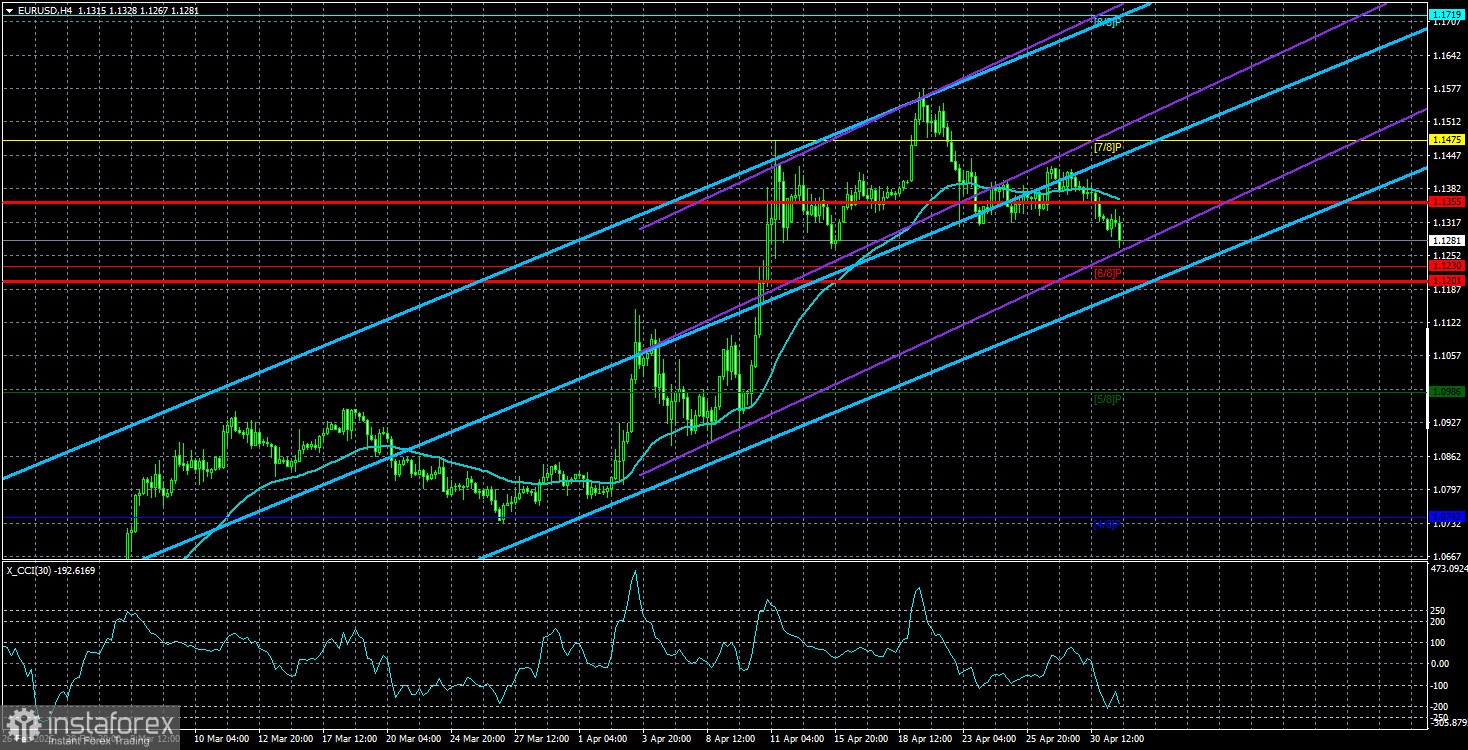
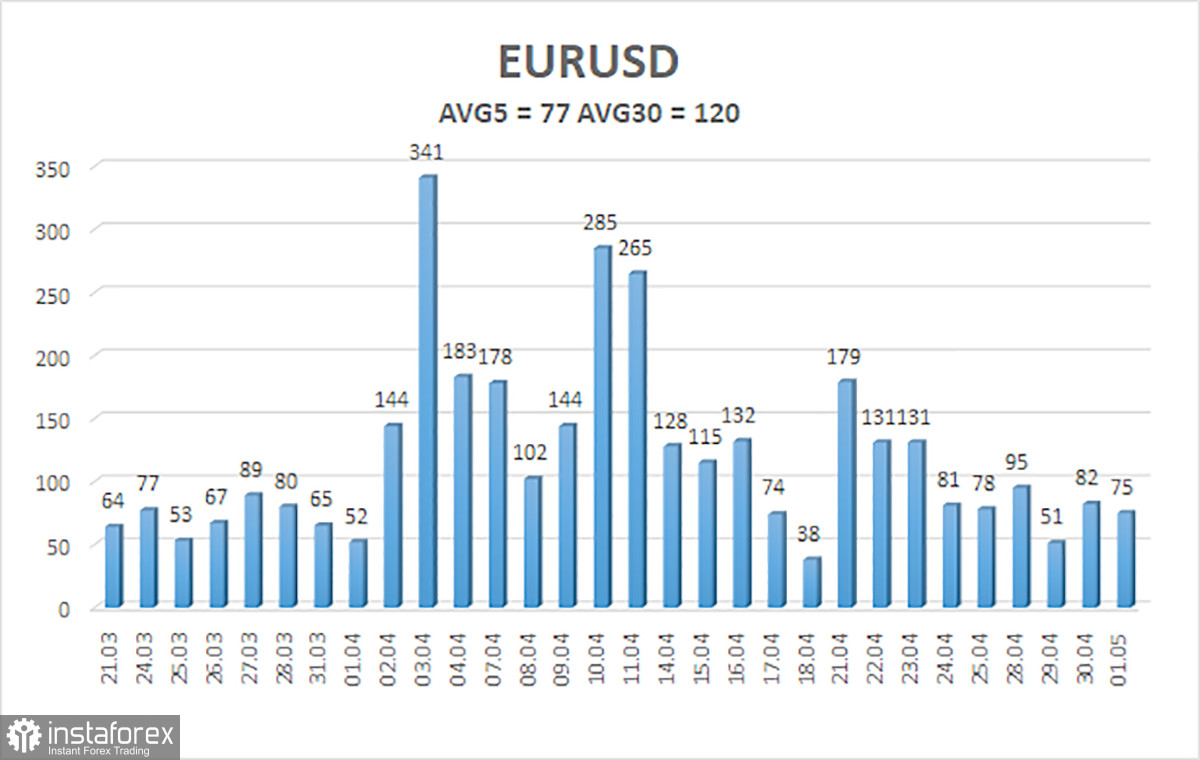
The average volatility for EUR/USD over the past five trading days as of May 2 is 77 pips, which is classified as moderate. On Friday, we expect the pair to move between 1.1201 and 1.1355. The long-term regression channel points upward, indicating a short-term bullish trend. The CCI indicator has entered the overbought zone three times, but it only triggered a minor correction each time.
Nearest Support Levels:
S1 – 1.1230
S2 – 1.0986
S3 – 1.0742
Nearest Resistance Levels:
R1 – 1.1475
R2 – 1.1719
R3 – 1.1963
Trading Recommendations:
EUR/USD has entered a downward correction within a broader uptrend. For months, we've consistently said we expect the euro to fall in the medium term, and that outlook hasn't changed. The dollar still lacks medium-term reasons to rise — except for Donald Trump. But that alone may be enough to continue dragging the dollar down while the market ignores every other factor. If you're trading based on pure technicals or Trump headlines, then long positions remain valid as long as the price is above the moving average, with a target at 1.1475. Short positions become relevant if the pair consolidates below the moving average, with targets at 1.1230 and 1.1201. It is quite challenging to have faith in a strong rally for the dollar at this time.
Explanation of Illustrations:
Linear Regression Channels help determine the current trend. If both channels are aligned, it indicates a strong trend.
Moving Average Line (settings: 20,0, smoothed) defines the short-term trend and guides the trading direction.
Murray Levels act as target levels for movements and corrections.
Volatility Levels (red lines) represent the likely price range for the pair over the next 24 hours based on current volatility readings.
CCI Indicator: If it enters the oversold region (below -250) or overbought region (above +250), it signals an impending trend reversal in the opposite direction.