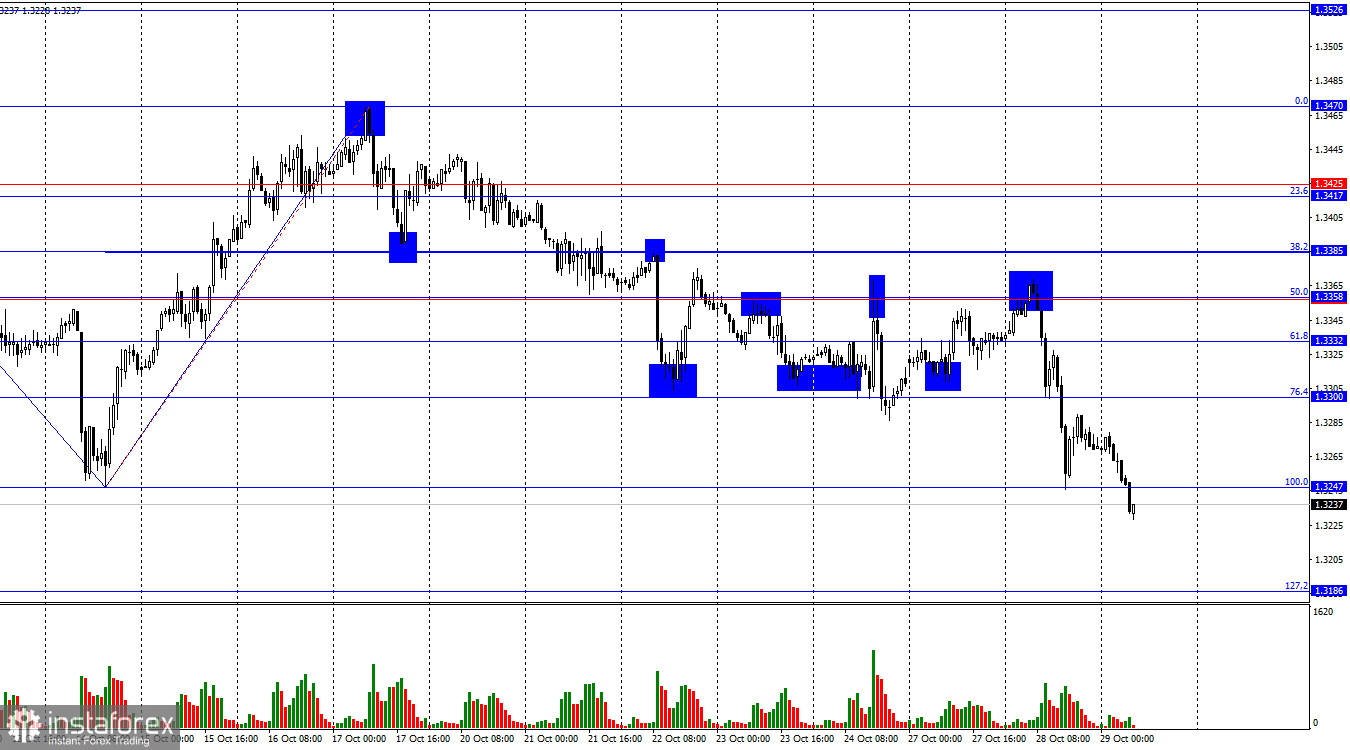
On the hourly chart, the GBP/USD pair on Tuesday reversed in favor of the U.S. dollar and showed a strong decline, which led to a reconstruction of the Fibonacci grid. Today, a consolidation of quotes below the 100.0% Fibonacci level at 1.3247 allows us to expect a continued fall toward the next corrective level of 127.2% – 1.3186. The British pound has been declining for the second day in a row, raising many questions.
The wave structure has now turned bearish. The last completed upward wave broke the previous high, while the latest downward wave broke the previous low. In recent weeks, the news background has been generally negative for the U.S. dollar, but bullish traders never took advantage of the opportunities to push higher. This week, they have abruptly retreated from the market altogether, despite the high likelihood of a Federal Reserve rate cut.
On Tuesday, there were no important events or news in either the UK or the US, yet traders still found a new reason to sell the pound. As it turned out, Rachel Reeves, the UK's Chancellor of the Exchequer, stated yesterday that the country seeks to restore close ties with the EU, hinting that Brexit was a mistake and brought nothing positive or beneficial to the UK economy. Personally, I don't see anything negative for the British economy or the pound in establishing close and mutually beneficial cooperation with the European Union — and, for example, the euro doesn't seem to see anything wrong with it either. However, the pound collapsed yesterday as if cut down, and today continues to fall despite the upcoming evening Fed meeting, which will likely bring monetary policy easing.
Thus, I continue to believe that the pound's decline is not entirely justified, but the bears are not retreating, and the bulls do not seem to oppose it. The only option left is to follow the market and the price. The Fed meeting this evening may trigger bullish attacks, but they are likely to be just counterattacks. The trend is now bearish again, meaning that a trend reversal will be required before we can expect new growth.
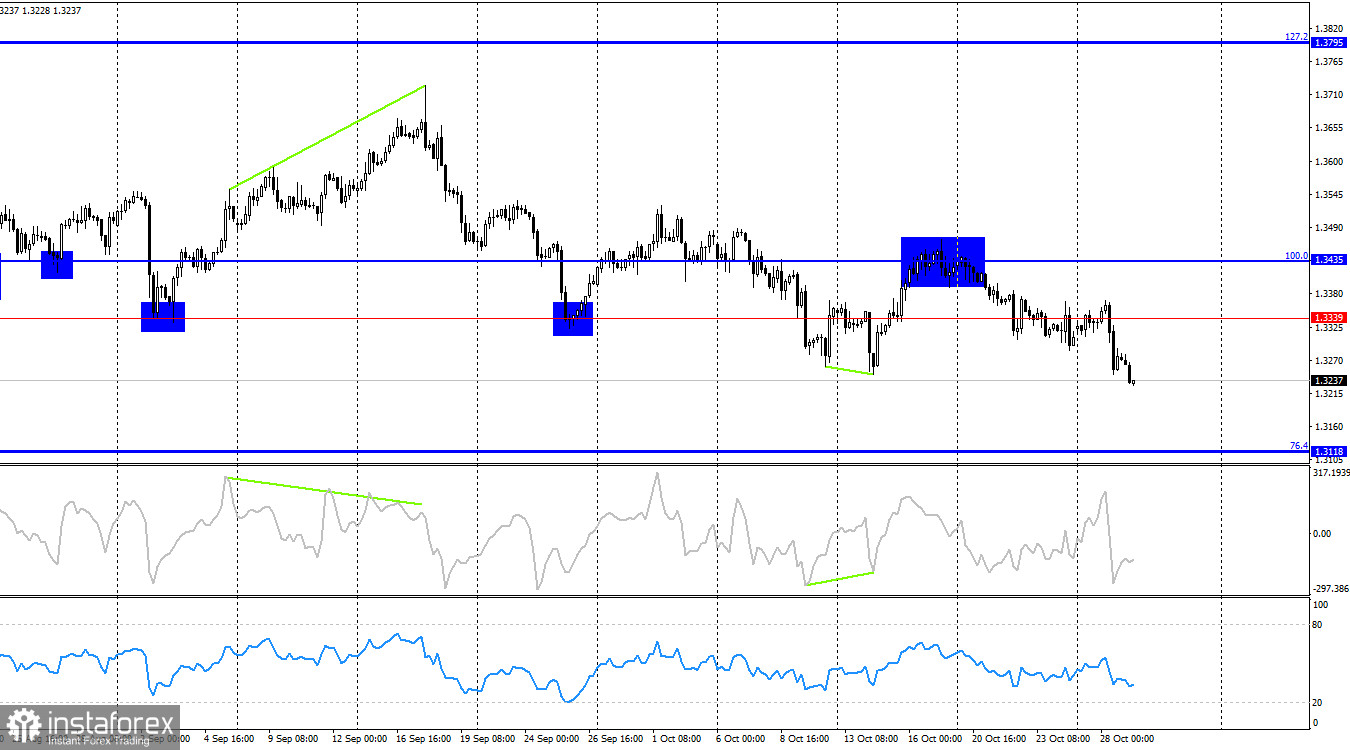
On the 4-hour chart, the pair rebounded from the 100.0% corrective level at 1.3435, which worked in favor of the U.S. dollar, marking the start of a new decline toward the 76.4% Fibonacci level at 1.3118. No emerging divergences are observed on any indicators. The hourly chart is currently more informative than the 4-hour one.
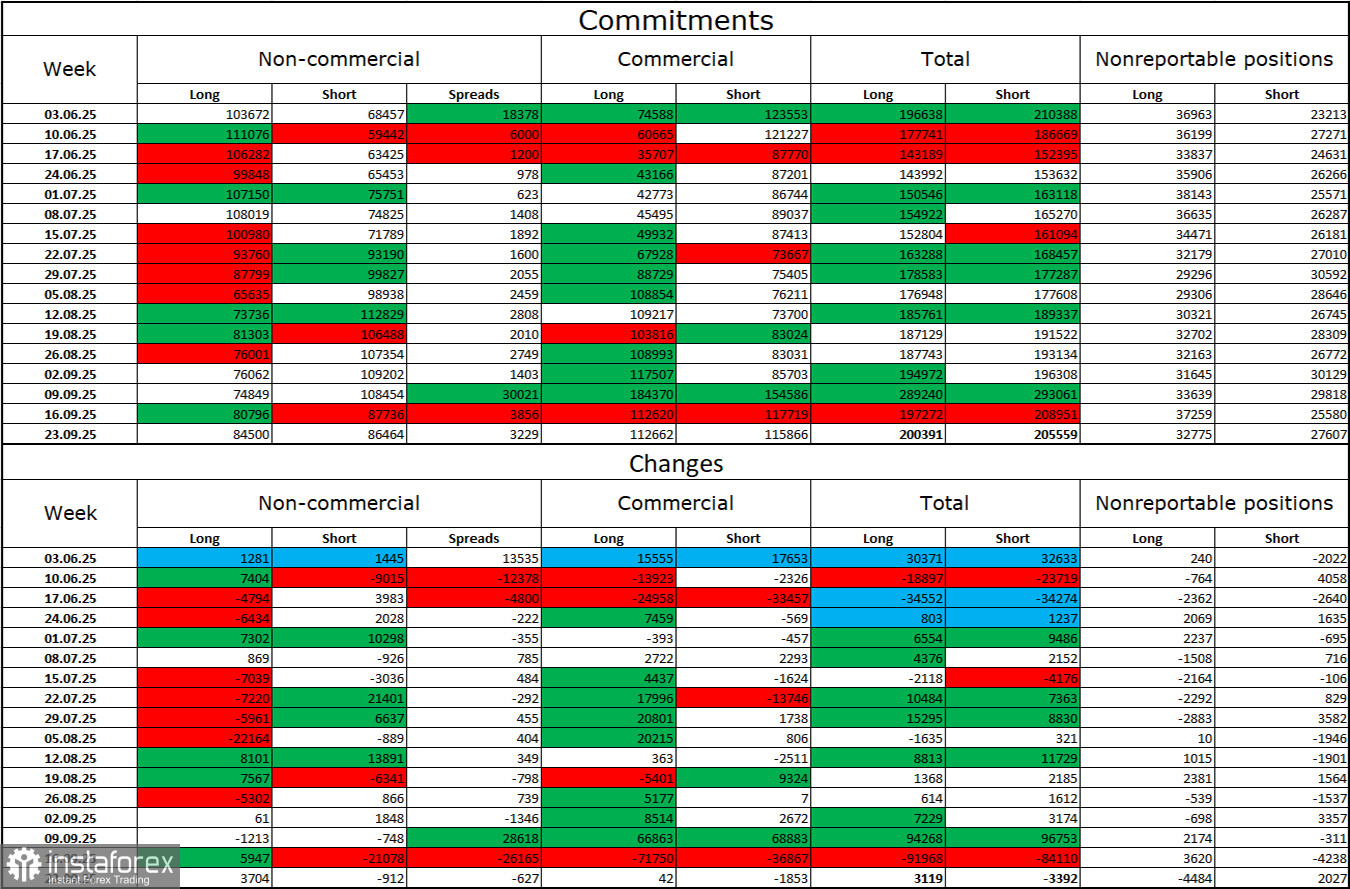
Commitments of Traders (COT) Report
The sentiment of the Non-commercial category became more bullish over the last reported week (which, however, was a month ago). The number of long positions held by speculators increased by 3,704, while the number of short positions decreased by 912. The gap between long and short positions now stands at approximately 85,000 vs. 86,000. Bullish traders are once again tipping the balance slightly in their favor.
In my view, the pound still retains downward potential, though with each passing month, the U.S. dollar looks increasingly weak. Whereas earlier traders were worried about Donald Trump's protectionist policies, not yet realizing their consequences, now they are concerned about the aftereffects — a possible recession, the constant introduction of new tariffs, and Trump's conflict with the Fed, which could result in the regulator becoming politically influenced. Thus, the pound now looks much less risky than the U.S. dollar.
News Calendar for the U.S. and the U.K.:
- U.S. – FOMC monetary policy decision (18:00 UTC)
- U.S. – Federal Reserve press conference (18:30 UTC)
The October 29 economic calendar includes two key events, both of which are important. The influence of the news background on market sentiment on Wednesday will be felt, but only in the evening.
GBP/USD Forecast and Trading Recommendations
Sales of the pair were possible after a close below the 1.3354–1.3357 zone on the hourly chart, with targets at 1.3313 and 1.3247. All these targets have been met, and a close below 1.3247 allows traders to hold short positions with a target of 1.3186. Buy positions can be considered upon a rebound from 1.3186 or a close above 1.3247 on the hourly chart.
Fibonacci grids are constructed between 1.3247 – 1.3470 on the hourly chart and 1.3431 – 1.2104 on the 4-hour chart.