GBP/USD 5M Analysis
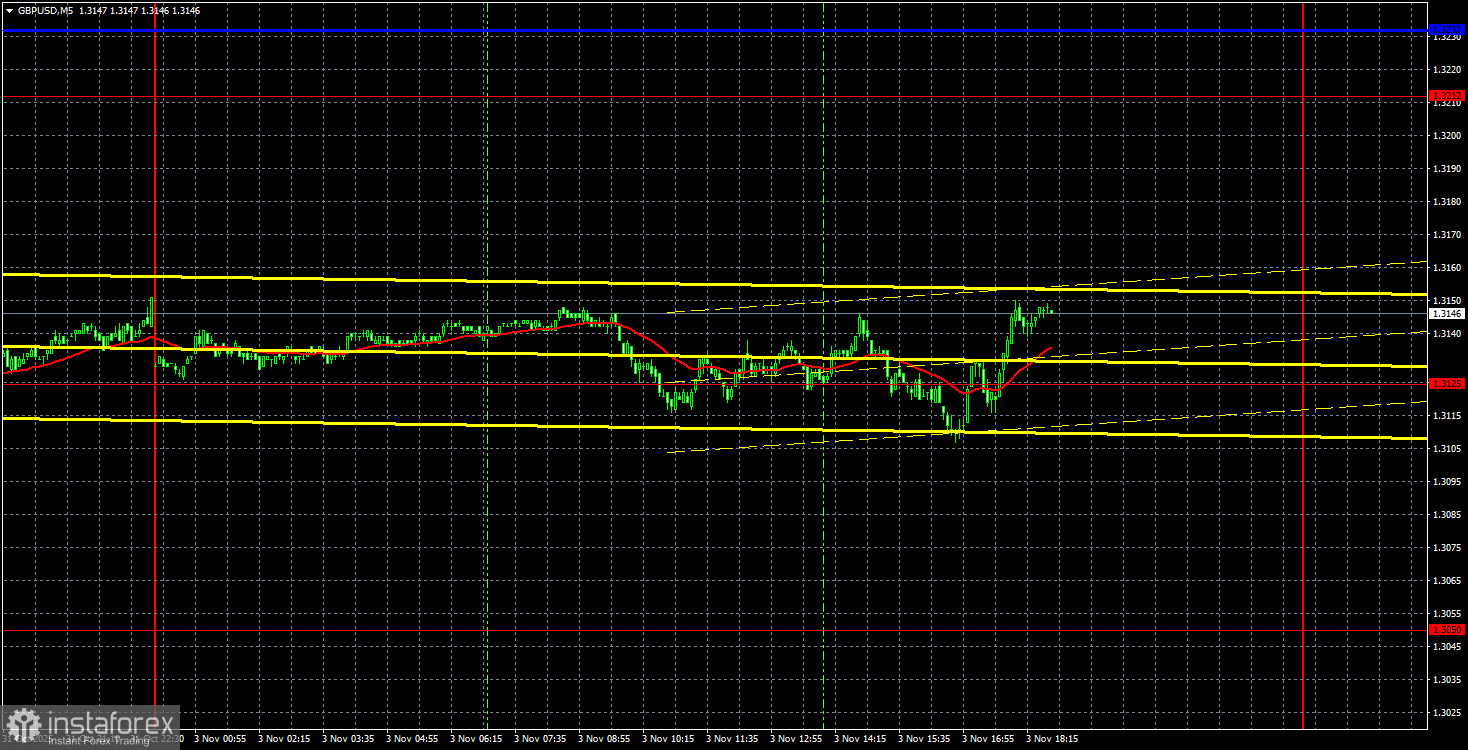
The GBP/USD currency pair on Monday attempted for the third time to break through the updated support level at 1.3115. There were again no grounds for the decline of the British currency, and during the day, only the manufacturing activity indexes for October were published in the UK and the US. The British index was released in its second estimate, generating little interest among traders. The US ISM index, released in a single estimate, provided a resonant figure but failed to spark any interest from traders. The US dollar had every reason to lose at least 50-60 pips on the ISM report yesterday, yet the expected decline did not occur.
From a technical standpoint, the pair continues to trade well below the trendline, so currently, grounds for buying the pair can only be found on the daily timeframe, where a flat pattern persists. For four consecutive days, the price has been testing the lower line of this sideways channel and might ultimately bounce back. However, Monday shows that the market is still in no rush to sell the US dollar. If the market does not sell the dollar, then, under any fundamental or macroeconomic backdrop, the pair will not rise.
On the 5-minute timeframe, the price crossed the 1.3125 level several times during the day, but overall volatility totaled only 44 pips, resulting in a sideways movement. We witnessed a classic dull Monday, which should not have been so dull given the ISM report in the US.
COT Report
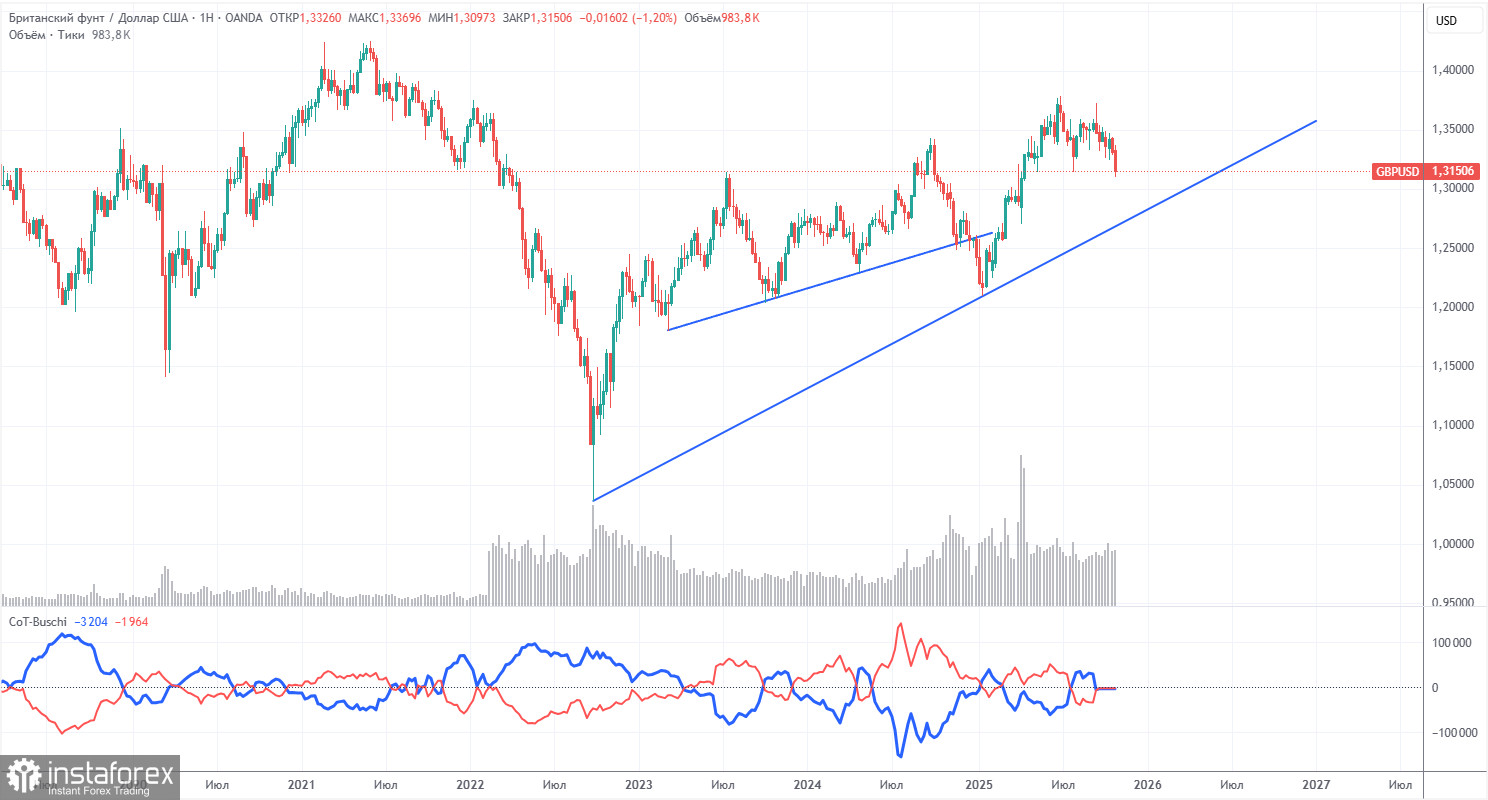
COT reports for the British pound show that sentiment among commercial traders has been changing rapidly in recent years. The red and blue lines reflecting the net positions of commercial and non-commercial traders frequently intersect and are mostly close to the zero mark. They are currently at almost the same level, indicating a roughly equal number of buy and sell positions.
The dollar continues to decline due to Donald Trump's policies, so, in principle, the demand for sterling among market makers is not particularly significant at the moment. The trade war will continue in one form or another for a long time, and the Fed is set to lower rates in the coming year, regardless. Demand for the dollar will decrease in any case. According to the latest report (dated September 23) on the British pound, the Non-commercial group opened 3,700 BUY contracts and closed 900 SELL contracts. Thus, the net position of non-commercial traders increased by 4,600 contracts over the week. However, this data is already outdated and holds no significance.
GBP/USD 1H Analysis
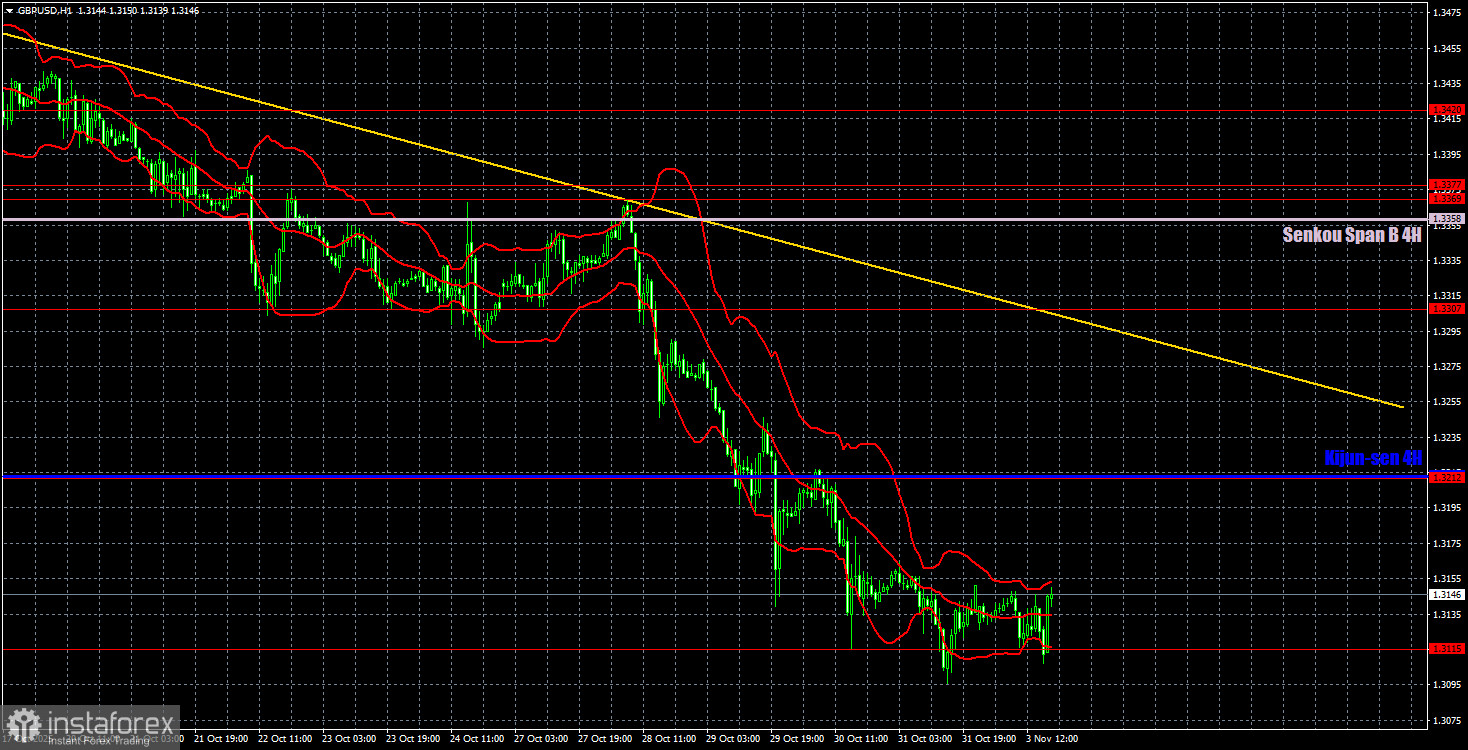
On the hourly timeframe, the GBP/USD pair remains in a downward trend. The dollar still lacks global reasons to strengthen, which leads us to expect the pair to grow toward the 2025 highs under almost any circumstances. The main point is to ensure that the flat on the daily timeframe concludes as quickly as possible. However, on the hourly timeframe, the trend is now downward, so at the very least, we expect a breakout of the trendline and the Senkou Span B line to have technical grounds for anticipating growth in the British currency.
For November 4, we highlight the following important levels: 1.3050, 1.3115, 1.3212, 1.3307, 1.3369–1.3377, 1.3420, 1.3533–1.3548, 1.3584, 1.3681. The Senkou Span B line (1.3358) and the Kijun-sen line (1.3213) may also serve as sources of signals. It is advisable to set your Stop Loss to breakeven if the price moves in the right direction by 20 pips. The Ichimoku indicator lines may shift throughout the day, which should be taken into account when determining trading signals.
On Tuesday, no significant events or reports are scheduled in the UK or the US, so today could be even duller than yesterday. Volatility for the pair may again be at zero.
Trading Recommendations:
Today, traders can trade from the 1.3115 level, where the price has bounced three times already. Short positions will become relevant if the price stabilizes below 1.3115, targeting 1.3050, although weak volatility may also be observed today.
Explanations for the Illustrations:
- Support and resistance price levels are represented by thick red lines, near which movement may end. They are not sources of trading signals.
- The Kijun-sen and Senkou Span B lines are Ichimoku indicator lines transferred to the hourly timeframe from the 4-hour timeframe. They are strong lines.
- Extremum levels are indicated by thin red lines, from which the price previously bounced. They are sources of trading signals.
- Yellow lines represent trendlines, trend channels, and any other technical patterns.
- Indicator 1 on the COT charts shows the size of the net position for each category of traders.