Trade Analysis for Tuesday:
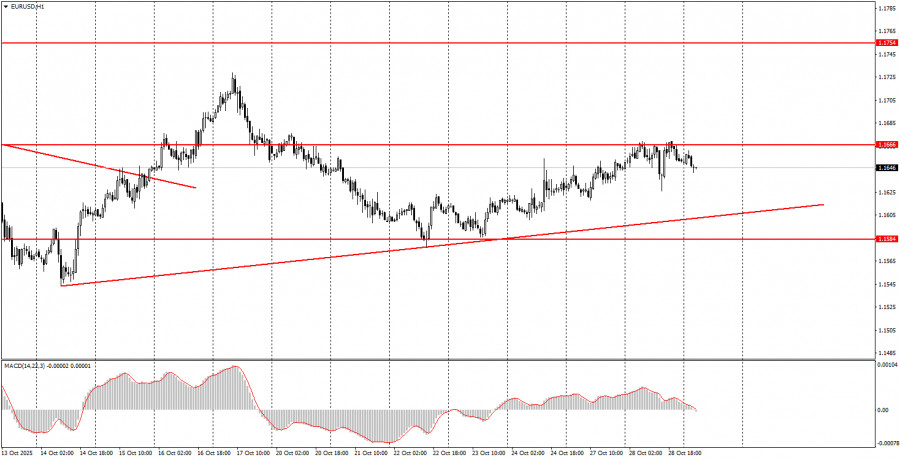
1H Chart of the EUR/USD Pair
The EUR/USD currency pair traded with minimal volatility on Tuesday. Throughout the day, there were no significant events published in the Eurozone or the U.S., but the British pound faced certain downward pressures, causing the European currency to decline alongside it in the first half of the day. By the second half of the day, the euro recovered, while the pound continued to fall for its own reasons. Consequently, the sharp moves we observed yesterday in the euro could have been absent if it weren't for yet another statement from UK Chancellor Rachel Reeves. The day's overall volatility was 43 pips.
This evening, the FOMC meeting will take place (or rather, conclude), so beginner traders can expect important information to come in. However, the Federal Reserve's decision is already widely known. It is dovish and predicts a second consecutive 0.25% rate cut. Logically, the pair should continue its upward movement today, but it is noteworthy that the euro has been reluctant to rise recently, despite having all the necessary grounds for such movement.
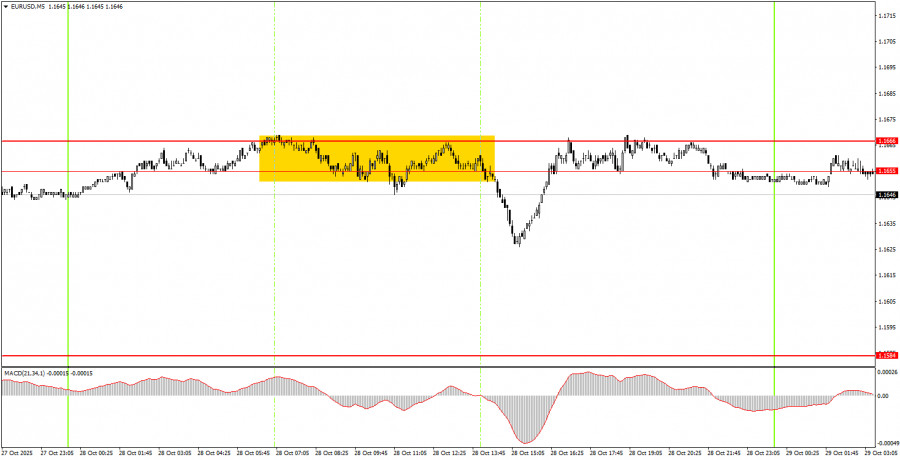
5M Chart of the EUR/USD Pair
On the 5-minute timeframe, only one trading signal was generated throughout Tuesday, but due to weak volatility and a degree of randomness, it was extremely difficult to achieve profitability from any trading signals, levels, or zones. At the beginning of the American trading session, the price bounced off the area of 1.1655-1.1666, which it could not breach again. After that, the price dipped about 20 pips before returning to the 1.1655-1.1666 range.
How to Trade on Wednesday:
On the hourly timeframe, the EUR/USD pair shows some signs of beginning an upward trend. A new upward trend line has been formed, and the overall fundamental and macroeconomic background remains unfavorable for the U.S. dollar. Hence, we continue to expect the resumption of the upward trend of 2025. However, a flat continues on the daily timeframe, which currently manifests as low volatility and illogical movements on the lower timeframes.
On Wednesday, novice traders could again trade from the area of 1.1655-1.1666. A new bounce from this area can serve as a reason to open short positions. A breakout of this area will present an opportunity to open long positions. We intentionally do not specify price targets, as volatility remains extremely low.
On the 5-minute timeframe, levels to consider include 1.1354-1.1363, 1.1413, 1.1455-1.1474, 1.1527, 1.1571-1.1584, 1.1655-1.1666, 1.1745-1.1754, 1.1808, 1.1851, 1.1908, and 1.1970-1.1988. On Wednesday, there are no significant events scheduled in the Eurozone, while the U.S. will have the FOMC meeting, which is likely to provoke strong market movements.
Basic Rules of the Trading System:
- The strength of a signal is determined by the time it takes to form the signal (bounce or breakout of a level). The less time it takes, the stronger the signal.
- If two or more trades based on false signals were opened around a specific level, all subsequent signals from that level should be ignored.
- In a flat market, any pair can generate numerous false signals or none at all. In any case, at the first signs of a flat, it is better to stop trading.
- Trades should be opened during the time period between the start of the European session and the middle of the American session, after which all trades should be closed manually.
- On the hourly timeframe, trading signals from the MACD indicator are ideally used only when there is good volatility and a trend confirmed by a trend line or trend channel.
- If two levels are too close together (5 to 20 pips apart), treat them as a support or resistance area.
- After a 15-pip move in the correct direction, a Stop Loss should be set to breakeven.
What's on the Charts:
- Price Support and Resistance Levels: Levels that serve as targets for opening buys or sells. Take Profit levels can be placed around them.
- Red Lines: Channels or trend lines that reflect the current trend and indicate the preferred direction for trading.
- MACD Indicator (14,22,3): The histogram and signal line – a supplementary indicator that can also be used as a source of signals.
Important speeches and reports (always found in the news calendar) can significantly impact the movement of the currency pair. Therefore, trading during their release should be done with utmost caution or exit the market to avoid sudden price reversals against the preceding movement.
Beginners trading in the Forex market should remember that not every trade can be profitable. Developing a clear strategy and effective money management are essential for success in trading over the long term.


