Wednesday's Trade Analysis:
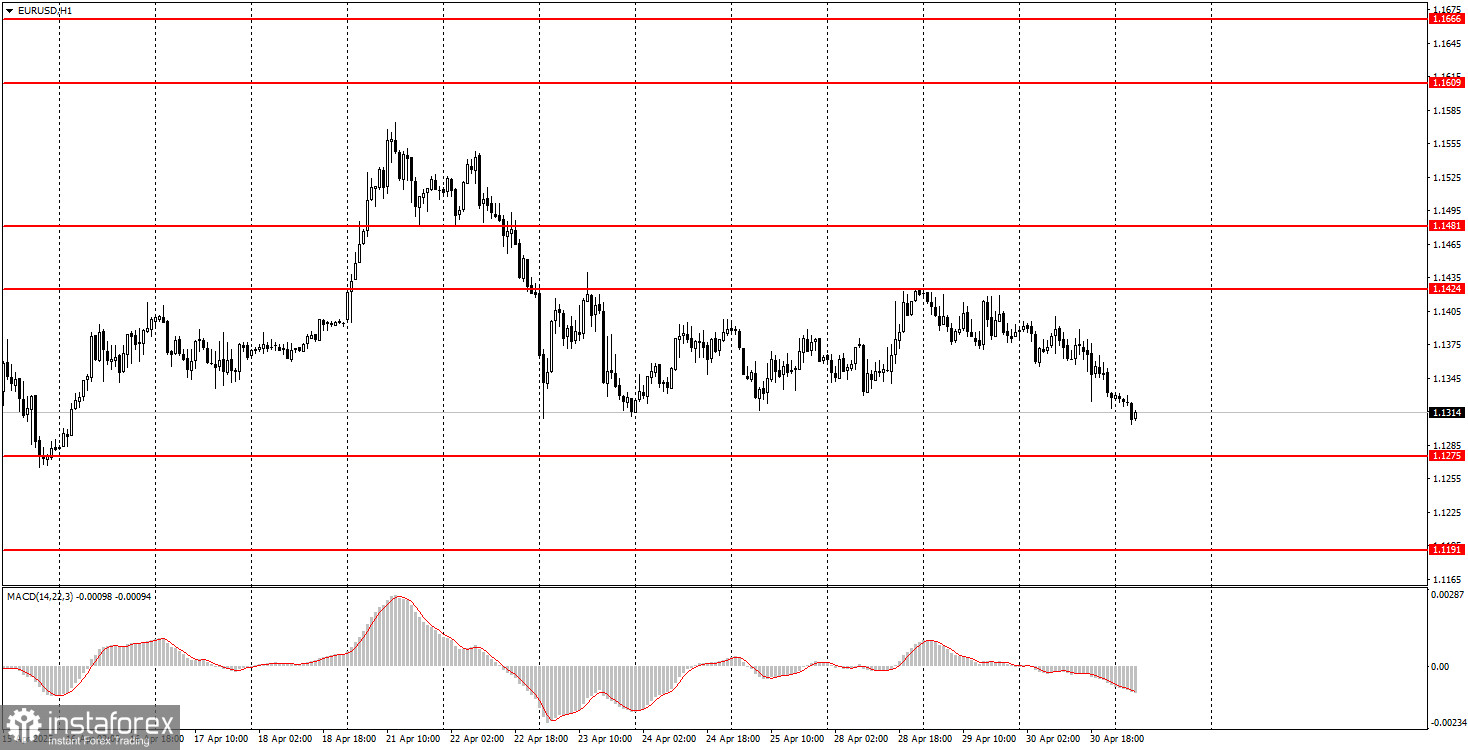
1H chart of the EUR/USD pair.
The EUR/USD currency pair continued its downward movement within the sideways channel on the hourly time frame on Wednesday — a channel clearly visible to the naked eye and persisting for over three weeks. After rebounding from the upper boundary of this channel (the 1.1424 level), the decline was expected. At the same time, a huge amount of macroeconomic data was published yesterday in both the Eurozone and the U.S., which could and should have influenced pricing. But that didn't happen. The market continues to ignore routine statistics, paying attention only to statements and decisions made by Donald Trump. Since the U.S. president hasn't raised tariffs lately, the dollar has stopped falling. But it also can't grow, as there are no signs of a de-escalation in the trade conflict. Moreover, it was revealed yesterday that the U.S. economy contracted by 0.3% in the first quarter under Trump. The last quarter under Biden ended with 2.4% growth. Thus, in any case, it will be extremely difficult for the dollar to show growth. Even the European or British economies are now growing faster than the American ones.
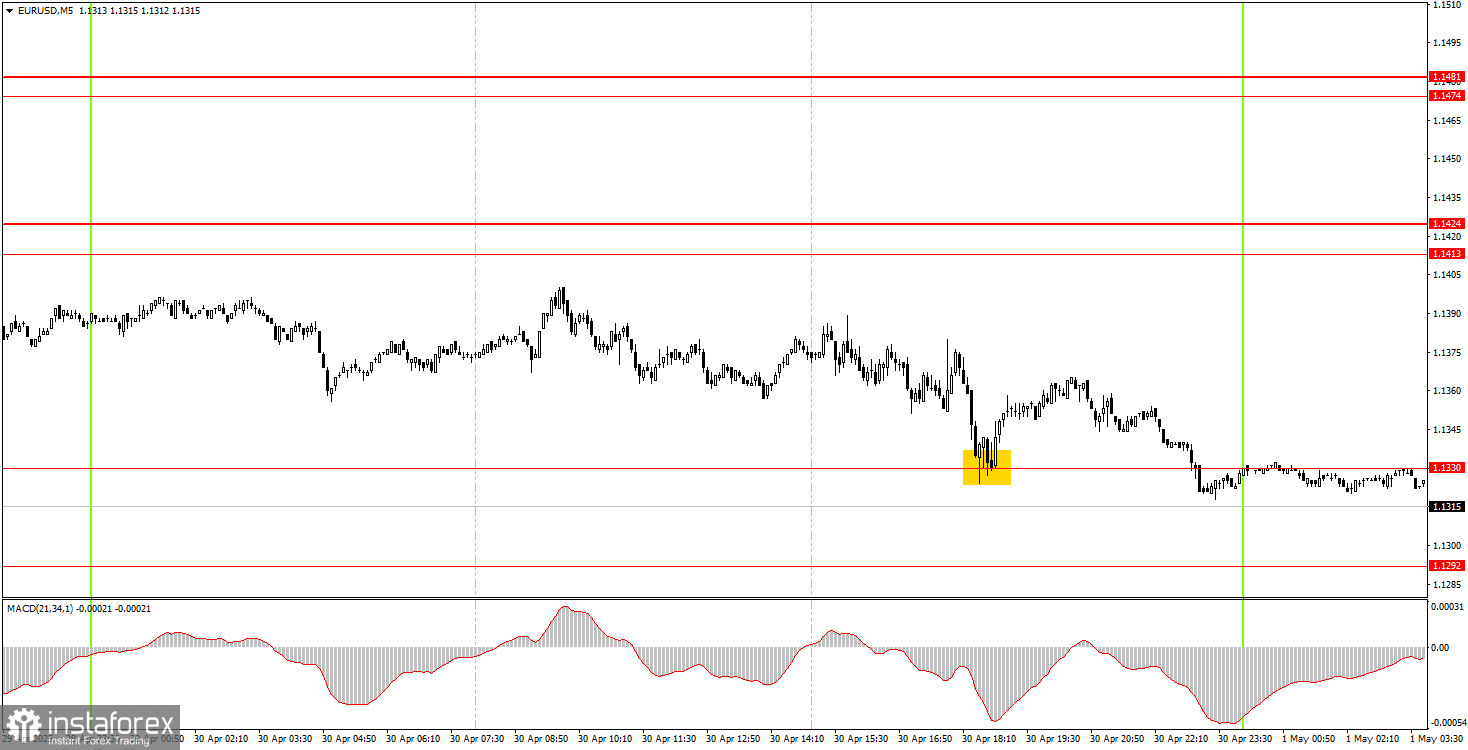
5M chart of the EUR/USD pair.
In the 5-minute time frame on Wednesday, only one trading signal was formed. At a certain point during the U.S. session, the price approached the 1.1330 level, rebounded from it, but managed to move up only 20 points. This was enough to set the Stop Loss to breakeven, where the trade was eventually closed.
How to Trade on Thursday:
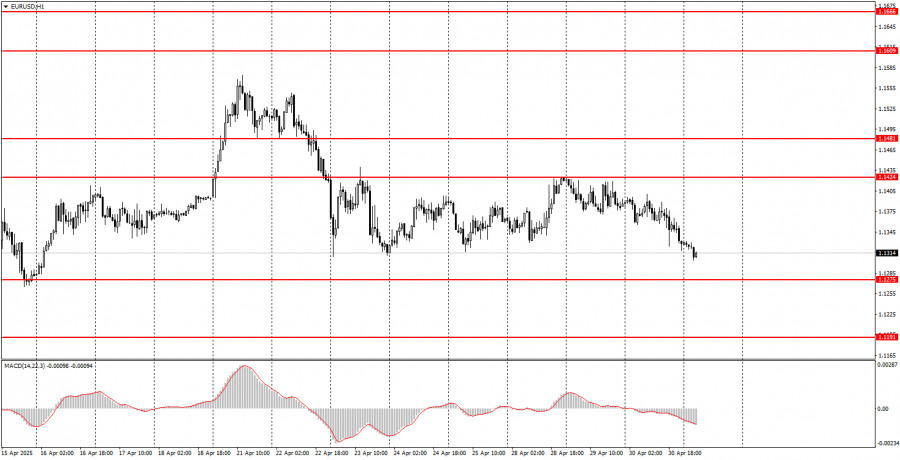
On the hourly time frame, the EUR/USD pair maintains a bullish trend. If we exclude the movements at the beginning of last week, the market has remained in a flat range for three weeks. Overall, market sentiment remains extremely negative toward the U.S. dollar and American policy in general. However, if Trump shifts toward de-escalating the trade conflict he himself started, the dollar may improve its position. When that might happen — or if it will happen at all — is unknown.
On Thursday, the pair may again move in either direction, since all market movements still depend on Trump's statements and decisions. We believe the flat market will continue for a while longer. A rebound from the lower boundary of the flat (1.1275) may lead to a rise in the pair.
On the 5-minute time frame, consider the levels: 1.0940–1.0952, 1.1011, 1.1091, 1.1132–1.1140, 1.1189–1.1191, 1.1275–1.1292, 1.1330, 1.1413–1.1424, 1.1474–1.1481, 1.1513, 1.1548, 1.1571, 1.1607–1.1622, 1.1666, 1.1689. There are no significant events scheduled in the Eurozone on Thursday, while the U.S. will publish the important ISM Manufacturing PMI. However, Wednesday has shown us that the market continues to ignore almost all reports.
Basic rules of the trading system:
- The strength of a signal is determined by how quickly it forms (bounce or breakout). The less time it takes, the stronger the signal.
- If two or more false signals are generated around a level, all further signals from that level should be ignored.
- In a flat market, any pair can produce many false signals or none at all. In any case, it's better to stop trading at the first signs of a flat.
- Trades should be opened during the period between the start of the European session and the middle of the U.S. session. All trades should be closed manually after that.
- On the hourly time frame, signals from the MACD indicator should only be used when there is good volatility and a trend confirmed by a trendline or trend channel.
- If two levels are too close together (5 to 20 points apart), they should be considered a support or resistance zone.
- After 15 points of movement in the correct direction, the Stop Loss should be moved to breakeven.
What's on the charts:
Price support and resistance levels – levels that serve as targets when opening buy or sell trades. Take Profit orders can be placed around them.
Red lines – channels or trendlines that indicate the current trend and suggest which direction is preferable for trading at the moment.
MACD Indicator (14, 22, 3) – histogram and signal line – a supplementary indicator that can also serve as a source of signals.
Important speeches and reports (always listed in the news calendar) can greatly affect the movement of a currency pair. Therefore, during their release, one should trade with maximum caution or exit the market to avoid a sharp price reversal against the preceding trend.
Beginner traders on the Forex market should remember that not every trade can be profitable. Developing a clear strategy and proper money management are key to long-term success in trading.