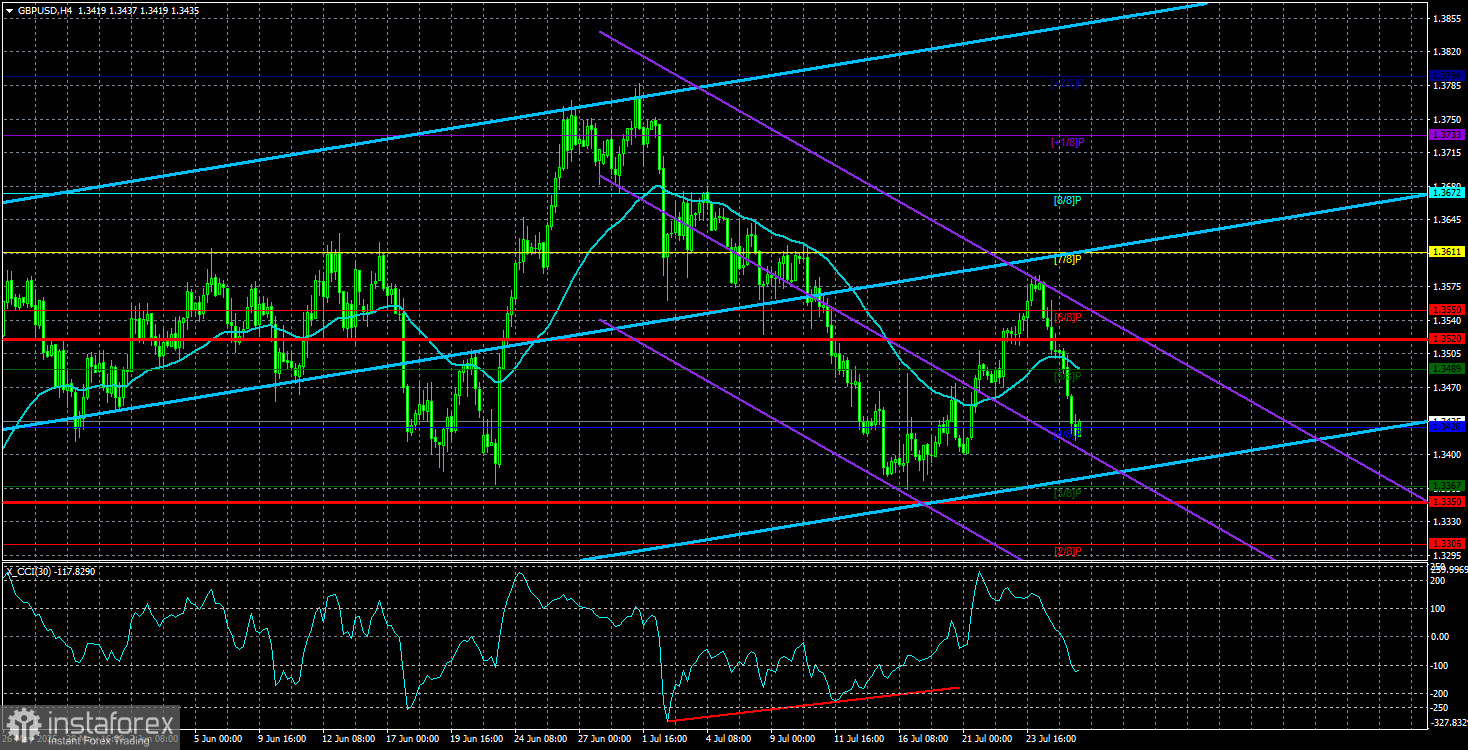
The GBP/USD currency pair declined significantly at the end of last week. This sharp drop in the British pound raises some confusion, as there were no solid reasons for such a move. We do not believe that the UK Services PMI or retail sales figures could have triggered a two-day plunge in the pound. Therefore, the only conclusion is that the price continues a correction. It is now better to focus not on the 4-hour timeframe, but on the daily one.
On the daily chart, it is clearly visible that the technical correction could continue, as the current decline in the British currency is still too shallow to qualify as a convincing correction. Thus, if the dollar continues to strengthen, it will be — as with the euro — purely on technical grounds.
Everything stated in the EUR/USD article also applies to GBP/USD. The macroeconomic backdrop still has virtually no influence, meaning it will not dictate the pair's direction next week. Traders may simply use various reports to trade in their desired direction. For example, further downward correction is quite possible now. So if U.S. data turn out to be positive, it may appear as though the market is buying the dollar based on that data — but the key factor will be technicals.
There are no major events scheduled in the UK, so traders will focus solely on U.S. data — of which there will be plenty. From less important reports like JOLTs job openings and the ADP employment change, to major releases such as Q2 GDP, NonFarm Payrolls, the unemployment rate, and the ISM Manufacturing PMI.
As mentioned earlier, the macroeconomic background can provoke local market reactions. Given the high volume of data, we may see multiple reversals and increased volatility. After last week's decline, we believe the market is inclined to continue correcting. Therefore, strong U.S. data will support such movement. If all or most American reports disappoint, the downward move could be weak, just like the second wave of correction.
In any case, technical analysis remains key to visualizing what's happening in the market. Right now, good trend indicators include the Ichimoku lines and the moving average. One should also not forget about the global trade war theme, as Donald Trump's new tariffs may trigger another drop in the dollar. Additionally, on Friday — August 1 — is the day when tariffs are set to increase for 24 countries that did not sign a trade agreement with the U.S. Tariffs on copper and pharmaceuticals imports are also scheduled to take effect on August 1, and no one knows what new tariffs Trump may introduce. There will be plenty of factors influencing the dollar exchange rate next week.
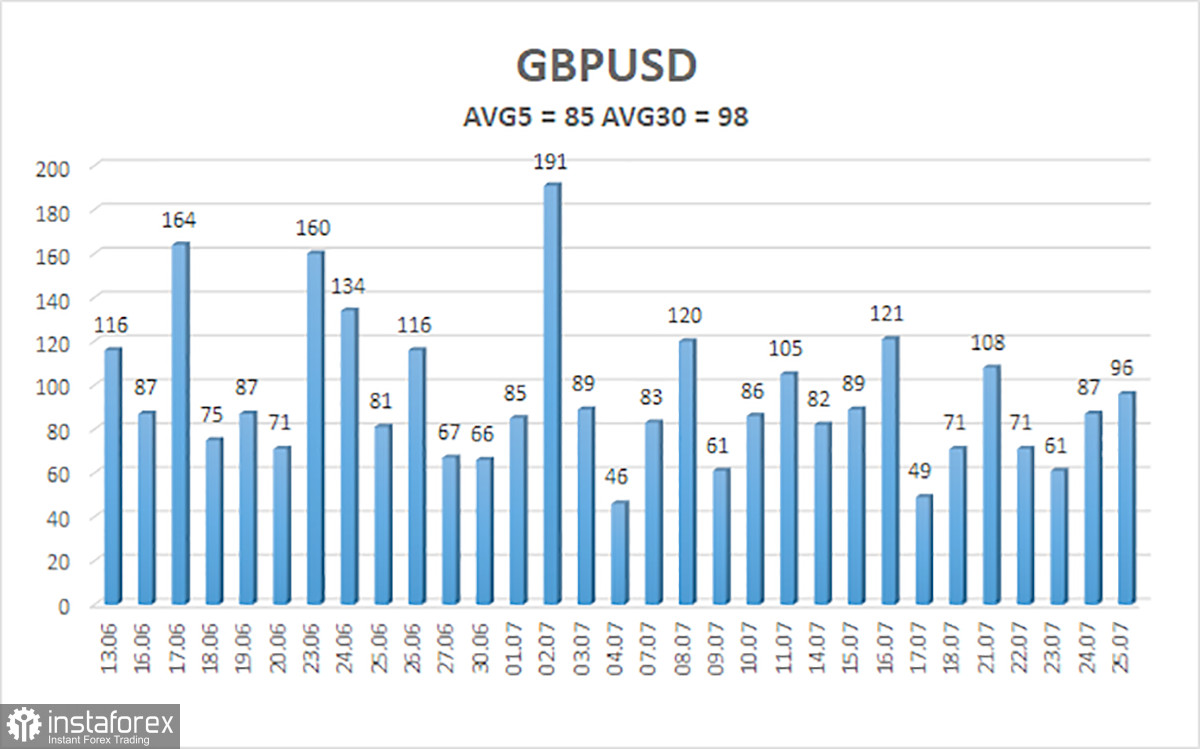
The average volatility of GBP/USD over the past five trading days is 85 pips, which is considered "moderate" for this pair. On Monday, July 28, we expect movement within the range defined by 1.3350 and 1.3520. The long-term linear regression channel is directed upward, indicating a clear upward trend. The CCI indicator entered the oversold zone twice, which signaled the resumption of the upward trend. Additionally, two bullish divergences have already formed, and a third one is now in progress.
Nearest Support Levels:
S1 – 1.3428
S2 – 1.3367
S3 – 1.3306
Nearest Resistance Levels:
R1 – 1.3489
R2 – 1.3550
R3 – 1.3611
Trading Recommendations:
GBP/USD has resumed a downward technical correction. In the medium term, Trump's policies are likely to continue putting pressure on the dollar. Therefore, long positions with targets at 1.3611 and 1.3672 remain relevant as long as the price is above the moving average. If the price is below the moving average line, short positions may be considered with a target at 1.3367, based purely on technical signals. From time to time, the U.S. dollar experiences corrections, but for a trend-driven strengthening to occur, we would need real signs of an end to the global trade war — which now seems unlikely.
Explanation of Illustrations:
Linear Regression Channels help determine the current trend. If both channels are aligned, it indicates a strong trend.
Moving Average Line (settings: 20,0, smoothed) defines the short-term trend and guides the trading direction.
Murray Levels act as target levels for movements and corrections.
Volatility Levels (red lines) represent the likely price range for the pair over the next 24 hours based on current volatility readings.
CCI Indicator: If it enters the oversold region (below -250) or overbought region (above +250), it signals an impending trend reversal in the opposite direction.