empty
 
 
17.06.2025 03:49 AM
Trading Recommendations and Analysis for EUR/USD on June 17: Geopolitics Played Its Part

EUR/USD 5-Minute Analysis

This image is no longer relevant

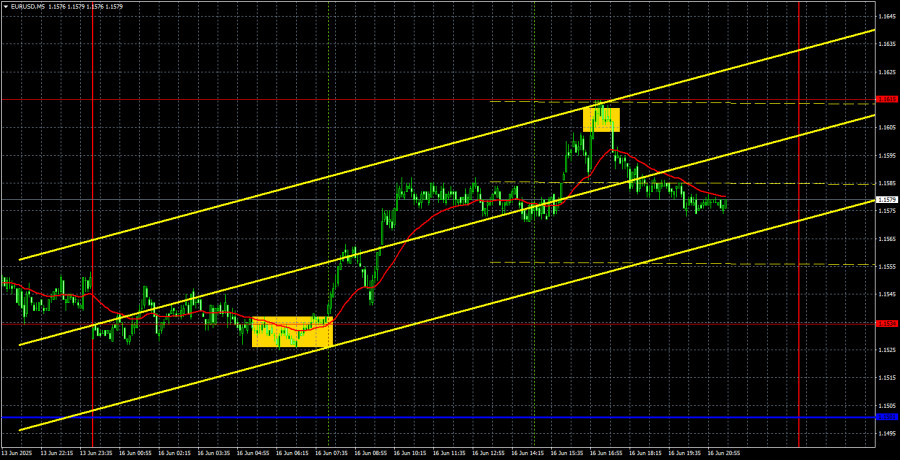
The EUR/USD currency pair showed a strong upward movement on Tuesday, just as we expected. No macroeconomic report—major or minor—was published during the day, so the latest decline in the U.S. dollar can be attributed solely to the events over the weekend.

Recall that on Friday, Israel launched a missile strike on Iran, destroying or damaging numerous military and nuclear facilities. The market reacted to this on Friday. However, on Saturday, Iran responded with its missile attacks, and as of Monday, the shelling from both sides was still ongoing.

The market had to digest this continued escalation of the war on Monday. Since it is now clear that heightened geopolitical tensions no longer support the U.S. dollar, the American currency once again declined against its rivals. Iranian authorities indicated they are willing to sign a peace agreement with Israel but refuse to abandon nuclear energy, which Washington demands. As a result, the military conflict continues, adding yet another bearish factor for the dollar.

Two trading signals were formed on Monday—both of excellent quality. At the start of the European trading session, the pair rebounded from the 1.1534 level, and during the U.S. session, it reached the nearest target at 1.1607 and then bounced back from it. Thus, traders had solid grounds to open long positions in the morning and short positions in the afternoon. The sell signal was not as profitable as the buy signal but still allowed for a few dozen pips in gains.

COT Report

This image is no longer relevant

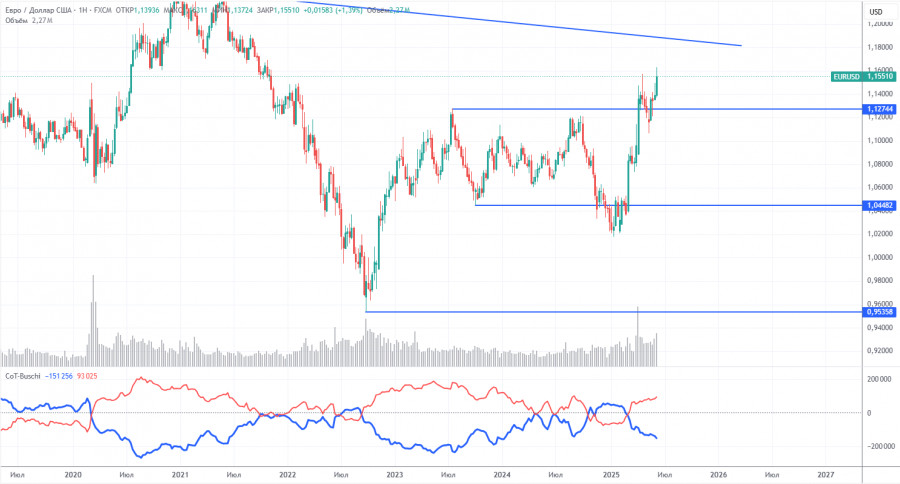
The latest COT report is dated June 10. As shown in the chart above, the net position of non-commercial traders has been bullish for a long time. Bears gained the upper hand briefly at the end of 2024 but quickly lost it. Since Trump assumed the U.S. presidency, the dollar has done nothing but decline.

We can't say with 100% certainty that the dollar will continue to fall, but current global developments suggest that it will.

We still don't see any fundamental drivers supporting the euro, but one strong reason remains for continued dollar weakness. The global downtrend is still in place, but who cares about the 16-year price history now? If Trump ends his trade wars, the dollar may start to rise again — but will he ever end them? And when?

The red and blue lines have crossed again, meaning the market trend has become bullish again. During the latest reporting week, long positions in the "Non-commercial" group rose by 6,000, while short positions declined by 4,300. Therefore, the net position increased by 10,300 over the week.

EUR/USD 1-Hour Analysis

This image is no longer relevant

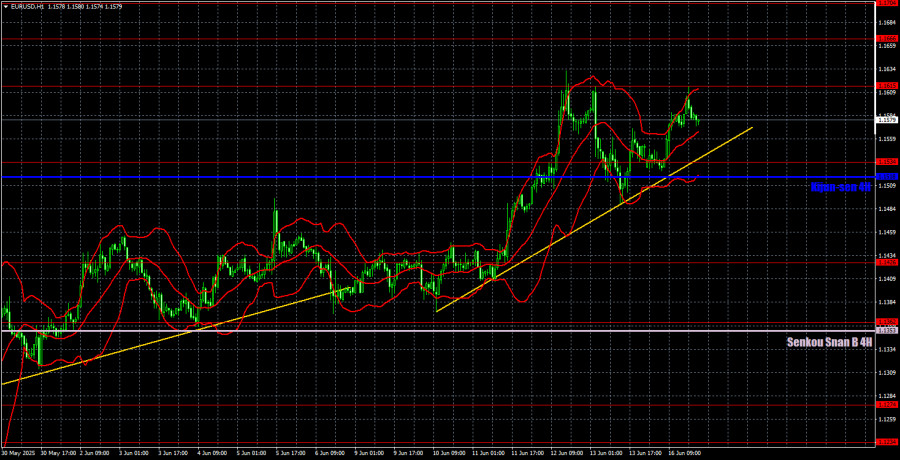
In the hourly timeframe, EUR/USD retains a local uptrend despite breaking through and surpassing all potential ascending trendlines. For the past four months, the market has reacted solely to events tied to Trump, his decisions, and the trade war. Now, to this already "wonderful and positive mix," we can add a full-fledged war in the Middle East. There is no good news, while negative news is abundant—hence, the dollar continues to depreciate briskly, which is very beneficial for Trump.

For June 17, we identify the following trading levels: 1.1092, 1.1147, 1.1185, 1.1234, 1.1274, 1.1362, 1.1426, 1.1534, 1.1615, 1.1666, 1.1704, 1.1750, as well as Senkou Span B (1.1353) and Kijun-sen (1.1518) lines. Remember that the Ichimoku indicator lines may shift during the day, so factor this in when identifying trade signals. Also, remember to place your Stop Loss at breakeven once the price moves 15 pips in the desired direction—this protects against potential losses if the signal turns out to be false.

On Tuesday, the ZEW Economic Sentiment Index will be published in the eurozone, and retail sales and industrial production data will be released in the U.S. While the U.S. reports may seem significant, we believe they will not significantly affect the pair's movement. The market is currently overwhelmed with geopolitical and economic developments, and the dollar has few opportunities to strengthen.

Illustration Explanations:

  • Support and resistance price levels – thick red lines where movement may end. They are not trading signal sources.
  • Kijun-sen and Senkou Span B lines—These are strong Ichimoku indicator lines transferred to the hourly timeframe from the 4-hour one.
  • Extremum levels – thin red lines where the price has previously rebounded. These act as trading signal sources.
  • Yellow lines – trend lines, trend channels, and other technical patterns.
  • COT Indicator 1 on the charts – the size of the net position for each category of traders.
Gana con los cambios en el valor de las criptomonedas con InstaForex.
Descarga MetaTrader 4 y abre tu primera operación.
  • Grand Choice
    Contest by
    InstaForex
    InstaForex always strives to help you
    fulfill your biggest dreams.
    UNIRSE AL CONCURSO
  • Depósito al azar
    ¡Haga un depósito en su cuenta de $3,000 y obtenga $1000 más!
    ¡En Junio, sorteamos $1000 dentro de la campaña Depósito afortunado!
    Obtenga la oportunidad de ganar depositando $3,000 en una cuenta de operaciones. Tras haber cumplido esta condición, se convertirá en un participante de la campaña.
    UNIRSE AL CONCURSO
  • Opere de forma inteligente, gane un dispositivo
    Recargue su cuenta con al menos $500, regístrese en el concurso y tenga la oportunidad de ganar dispositivos móviles.
    UNIRSE AL CONCURSO
  • 100% de bonificación
    Su oportunidad única de obtener un bono del 100 % en su depósito
    OBTENER BONO
  • 55% de bonificación
    Solicite un bono del 55% en cada depósito
    OBTENER BONO
  • 30% de bonificación
    Reciba un bono del 30% cada vez que recargue su cuenta
    OBTENER BONO

Recommended Stories

¿No puede hablar ahora mismo?
Ingrese su pregunta en el chat.
Widget callback