Trade Analysis for Thursday:
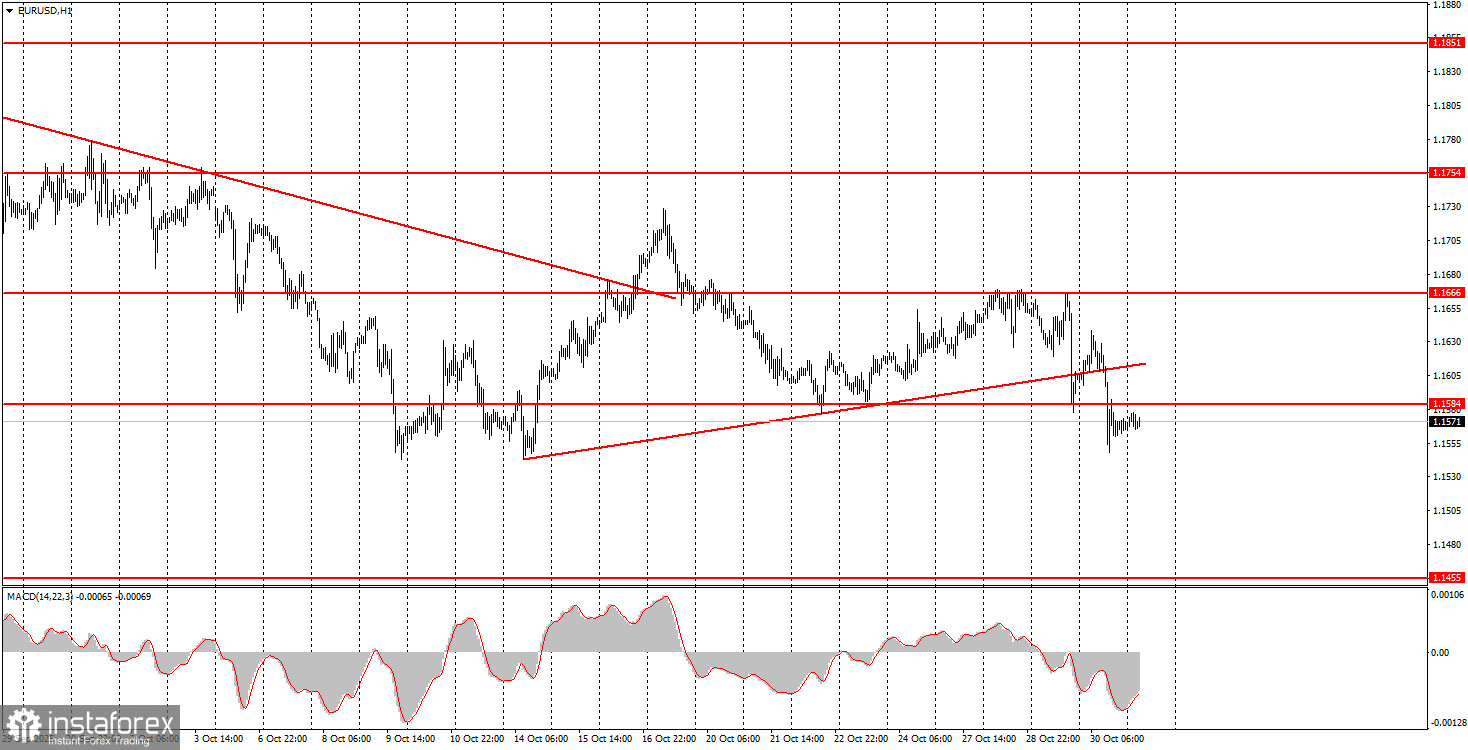
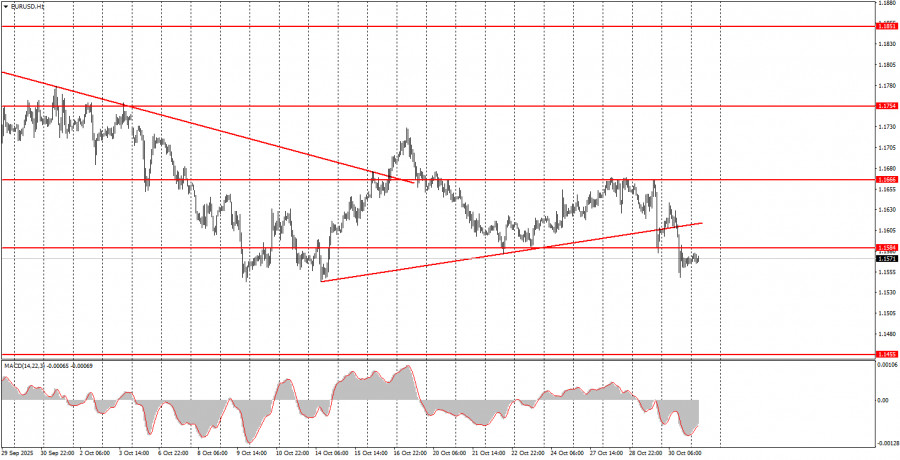
1H Chart of the EUR/USD Pair
The EUR/USD pair continued its decline on Thursday after breaching yet another ascending trend line the day before. The European currency is falling again; the flat on the daily timeframe persists, and the global upward trend for 2025 remains in place. Therefore, we continue to expect only growth. Yesterday, there was very little logic to the pair's movements. The market began to shed euros early in the morning, even before the publication of macroeconomic statistics in the Eurozone and the European Central Bank meeting. This means traders did not even wait for important data, continuing to process the results of the FOMC meeting, which could hardly be called "super-dovish." Subsequently, reports on GDP released from Germany and the Eurozone did not suggest new difficulties for the euro. The unemployment rate in Germany was also not disappointing. Inflation in Germany came in lower than expected. Thus, none of the reports indicated a reason for the decline of the European currency. The same conclusion applies to the ECB meeting, which produced exactly the decisions the market anticipated.
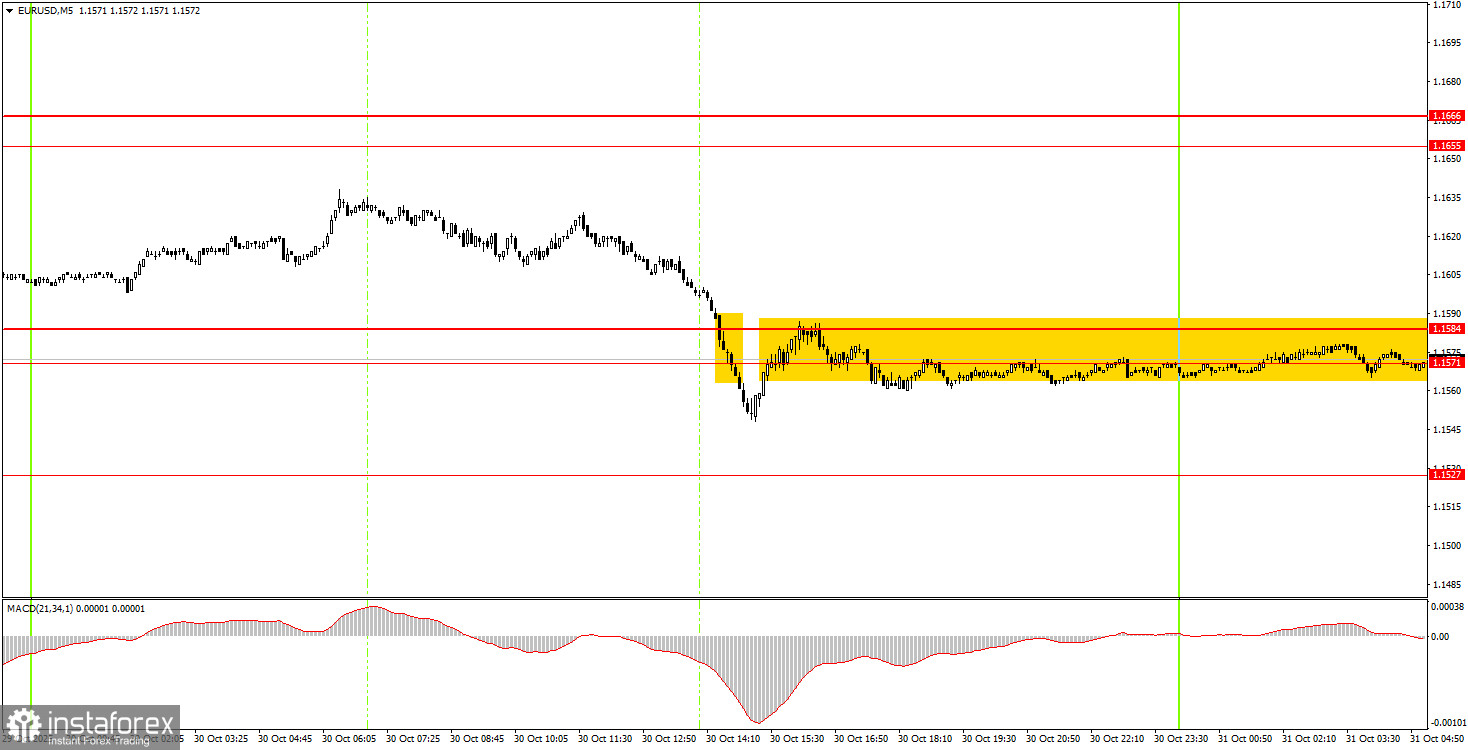
5M Chart of the EUR/USD Pair
On the 5-minute timeframe, one trading signal was formed on Thursday. At the beginning of the American trading session, the price settled below the area of 1.1571-1.1584, and that marked the end of all movements. Thus, novice traders likely found it difficult to profit from the lone short position, but there was no loss either, as the price remained around this area.
How to Trade on Friday:
On the hourly timeframe, the EUR/USD pair is again showing a desire to continue its decline. The new ascending trend line has been breached, and the overall fundamental and macroeconomic backdrop remains unfavorable for the US dollar. Thus, on a technical basis, the European currency may continue to decline. However, the flat on the daily timeframe remains relevant, so we are waiting for it to end and for the upward trend to resume.
On Friday, novice traders can trade from the area of 1.1571-1.1584, where the pair is currently located. A bounce from this area would be a reason to open short positions with a target of 1.1527. A consolidation above this area presents an opportunity to open long positions targeting 1.1655.
On the 5-minute timeframe, you should consider trading at levels 1.1354-1.1363, 1.1413, 1.1455-1.1474, 1.1527, 1.1571-1.1584, 1.1655-1.1666, 1.1745-1.1754, 1.1808, 1.1851, 1.1908, 1.1970-1.1988. On Friday, only two reports are scheduled in the Eurozone, but yesterday the market essentially ignored a much larger package of macroeconomic data. Today, Germany will release a retail sales report, and the Eurozone will release its inflation report. Let's remember that inflation currently has little influence on the ECB's monetary policy.
Core Principles of the Trading System:
- The strength of a signal is determined by the time it took to form (bounce or breakout). The less time required, the stronger the signal.
- If two or more trades have been opened around a certain level based on false signals, all subsequent signals from that level should be ignored.
- In a flat market, any pair can produce numerous false signals or none at all. At the first signs of a flat, it is better to cease trading.
- Trades should be opened during the time frame between the start of the European session and the middle of the American session, and then all trades should be closed manually.
- On the hourly timeframe, trade signals from the MACD indicator should ideally only be traded in the presence of good volatility and a trend confirmed by a trendline or trending channel.
- If two levels are too close to each other (5 to 20 pips), they should be considered as a support or resistance area.
- After moving 15 pips in the right direction, set the Stop Loss to breakeven.
What's on the Charts:
- Support and Resistance Levels: Levels that serve as targets for buying or selling. Take Profit levels can be placed near these levels.
- Red Lines: Channels or trend lines that display the current trend and indicate the preferred direction for trading.
- MACD Indicator (14,22,3): Histogram and signal line serve as a supplementary indicator that can also be used as a source of signals.
Important: Important speeches and reports (always found in the news calendar) can significantly impact currency movements. Therefore, during their release, trading should be approached with utmost caution or exit the market to avoid sharp price reversals against the preceding movements.
Beginners trading in the Forex market should remember that not every trade can be profitable. Establishing a clear strategy and money management principles are essential for success in trading over the long term.