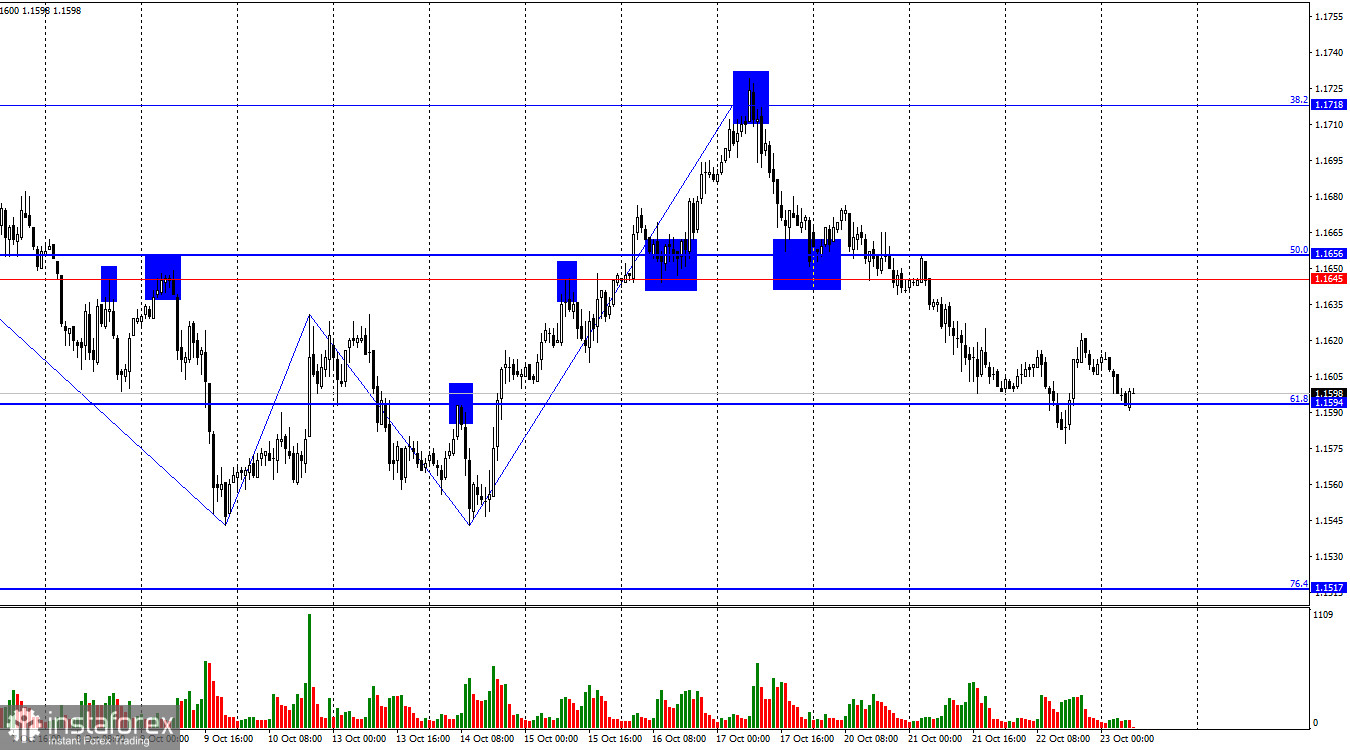
On Wednesday, the EUR/USD pair attempted to extend its decline but failed to consolidate below the 61.8% Fibonacci retracement level at 1.1594. A rebound from this level will favor the European currency and some upward movement toward the resistance level of 1.1645–1.1656. A consolidation of the pair's rate below 1.1594 will increase the likelihood of further decline toward the next Fibonacci level of 76.4% – 1.1517. It should be noted that the current trend remains bullish.
The wave pattern on the hourly chart remains clear and straightforward. The last upward wave broke the previous wave's high, while the most recent completed downward wave did not break the prior low. Thus, the trend has now shifted to bullish.
Recent labor market data, the changing monetary policy outlook for the Federal Reserve, Trump's renewed aggression toward China, and the government shutdown continue to support bullish traders. However, the bulls are still attacking very weakly — as if they simply don't want to, for reasons unknown.
On Wednesday, there was once again no major news in either the European Union or the United States. Yet bearish traders continue to act based on a single factor — faith in a trade agreement between China and the US. In my opinion, this faith is completely unfounded, since from both sides we mostly hear only new threats and new ultimatums — especially from Donald Trump. Nevertheless, there are currently no other reasons for the dollar's growth. This week, the US has released no significant reports and there have been no important speeches from FOMC members.
The Federal Reserve meeting will take place next week, and the market again believes in a rate cut, which is unlikely to be the last. However, this belief is not creating any pressure on the dollar.
Thus, the situation looks paradoxical: the markets believe in a US–China trade truce — and buy the dollar. The markets believe in Fed monetary easing — but do not sell the dollar. A strange situation indeed.
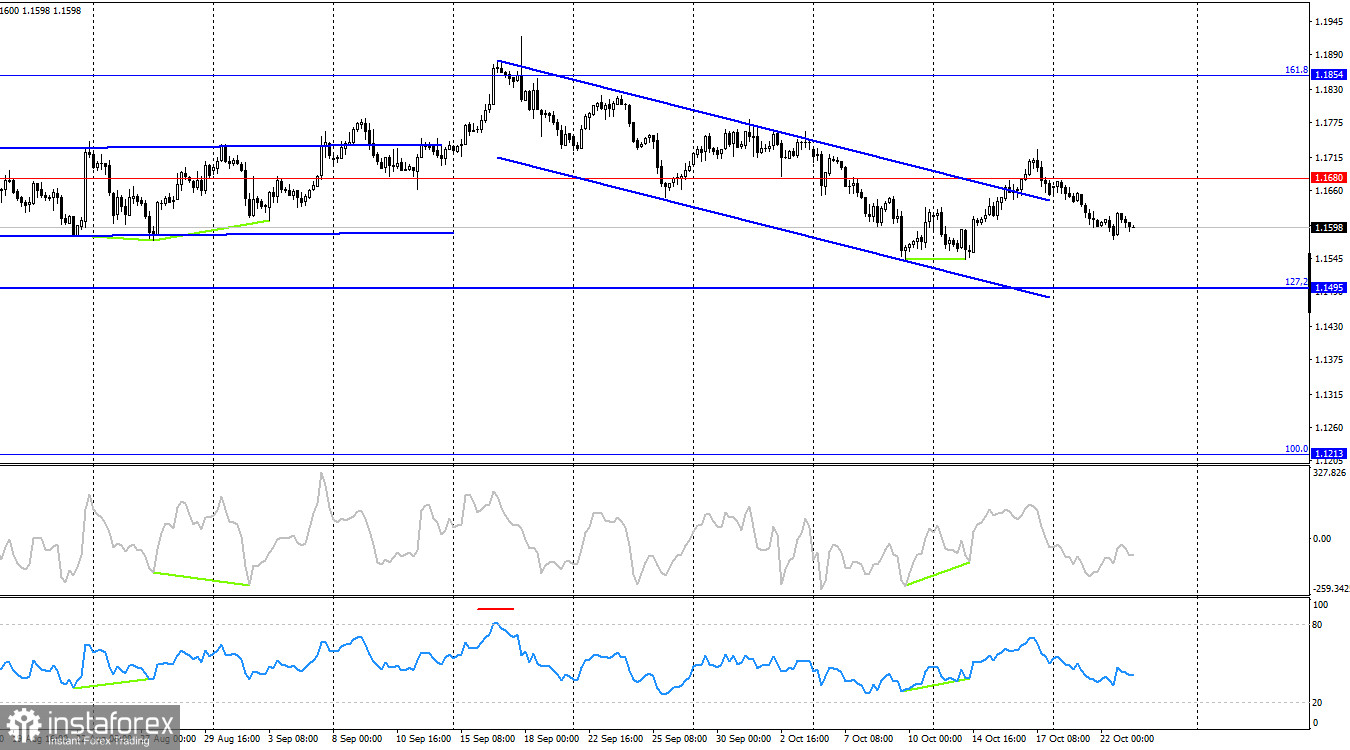
On the 4-hour chart, the pair turned in favor of the US dollar and consolidated below 1.1680, which allows traders to expect some decline. However, earlier there was also a breakout above the descending trend channel following the formation of a bullish divergence on the CCI indicator. Therefore, the upward movement may resume toward the next corrective level of 161.8% – 1.1854. Market movements remain very weak, and I believe hourly chart analysis is currently more relevant.
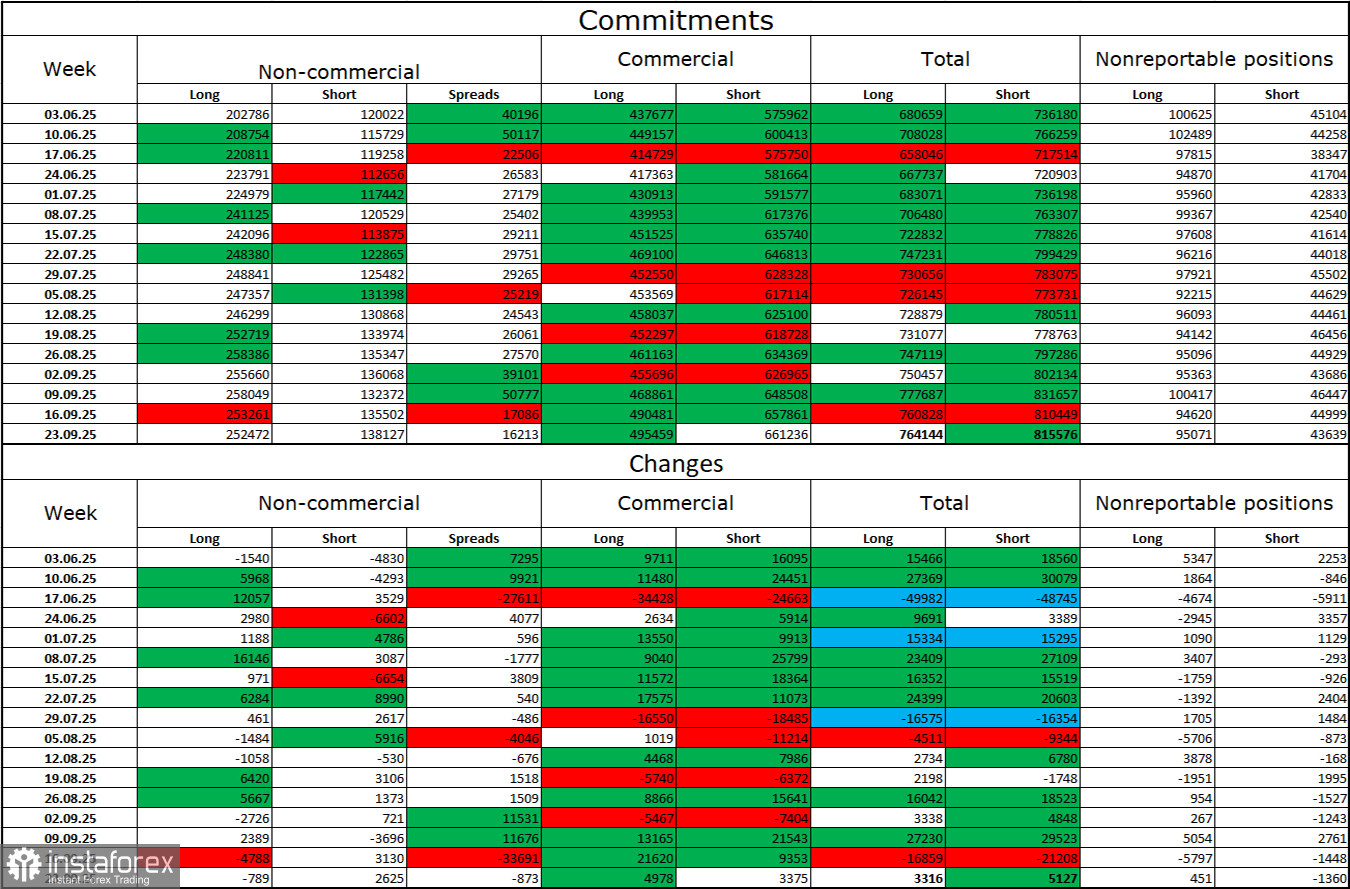
Commitments of Traders (COT) Report
During the latest reporting week, professional traders closed 789 long positions and opened 2,625 short positions. The sentiment of the "Non-commercial" category remains bullish, thanks in large part to Donald Trump, and continues to strengthen over time. The total number of long positions held by speculators now stands at 252,000, while short positions total 138,000 — a nearly twofold difference.
In addition, note the many green cells in the upper table — they indicate strong increases in euro positions. In most cases, interest in the euro continues to grow, while interest in the dollar declines.
For thirty-three consecutive weeks, large traders have been reducing their short positions and increasing their long positions. Donald Trump's policies remain the most significant factor for traders, as they may cause numerous long-term, structural problems for the US. Despite the signing of several key trade agreements, many of America's major economic indicators continue to decline.
News Calendar for the US and the Eurozone
United States – Home Sales (14:00 UTC)
On October 23, the economic calendar contains only one event, which is of little interest. Therefore, the information background will have little or no impact on market sentiment on Thursday.
EUR/USD Forecast and Trader Recommendations
Selling was possible on a rebound from 1.1718 on the hourly chart with a target at 1.1656. New selling opportunities emerged after a close below the 1.1645–1.1656 level with a target at 1.1594, which has also been reached.
New sell trades can be opened after a close below 1.1594, targeting 1.1517. Buying can be considered today on a rebound from 1.1594, with targets at 1.1645–1.1656.
Fibonacci grids are drawn between 1.1392–1.1919 on the hourly chart and 1.1214–1.0179 on the 4-hour chart.