The EUR/USD currency pair calmly and effortlessly returned to its original levels on Thursday, where it stood before the Fed's meeting results were announced. This is precisely what we warned about in previous articles: it often happens that the pair rockets in one direction, then the other, and then simply returns to where it began. As we can see, that's precisely what happened. That's why we urged against rushing to conclusions or making trade decisions during the Fed meeting. This event is quite deceptive, as many traders begin to trade impulsively and emotionally, so there's no logic in such movements.
For example, overall, you could say the dollar strengthened after the Fed meeting. Of course, this strengthening is, firstly, fairly nominal, and secondly, very weak. Nevertheless, why didn't the market just continue selling off the US currency, given that all available factors are in favor of that?
There could be several reasons, none directly tied to the Fed or the meeting's outcome (contrary to what most experts think). The first reason is purely emotional, illogical trading. Each major player "saw" what they wanted to see, made their own forecast, and so some were buying while others sold. As a result, the pair dropped just 50 points, which can't be considered a significant move.
The second reason is the market's pricing in anticipation of the Fed decision. Remember, the dollar had been falling for several weeks. While there are enough reasons for it to keep dropping for quite some time, who's to say that traders hadn't already priced in monetary easing from the Fed, especially since it was talked about back in August? So, when the results finally came out, the market was taking profit on longs rather than opening new ones.
Either way, what changed after the Fed meeting? We've said countless times that the main question is the pace of rate cuts. That's what determines how fast the dollar will fall in 2025 and 2026. If easing is slow and moderate, the dollar could end the year not far from $1.20 per euro. If easing is aggressive, we could see $1.30 for the euro next year. This isn't fantasy—it's an objective reality. Just look at where the pair was in January 2025 and ask yourself: did anyone expect such a collapse?
It's obvious to everyone that Donald Trump triggered this downfall. And the Republican hasn't left office yet—and has no intention of stopping. He continues to demand extreme rate cuts from the Fed, seeks to "reshape" the FOMC, and keeps threatening half the world with sanctions, tariffs, and all the rest. What has changed for the dollar that would make us expect it to strengthen?
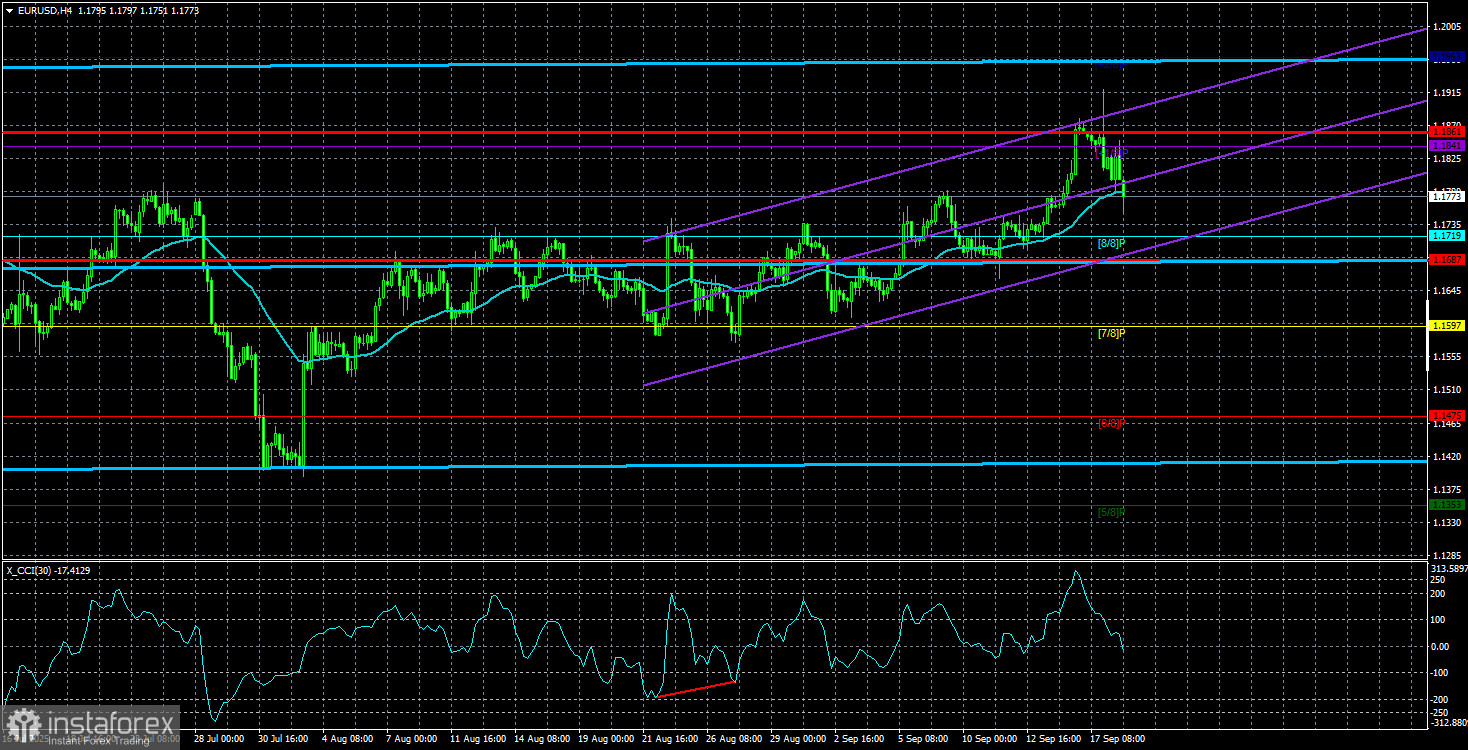
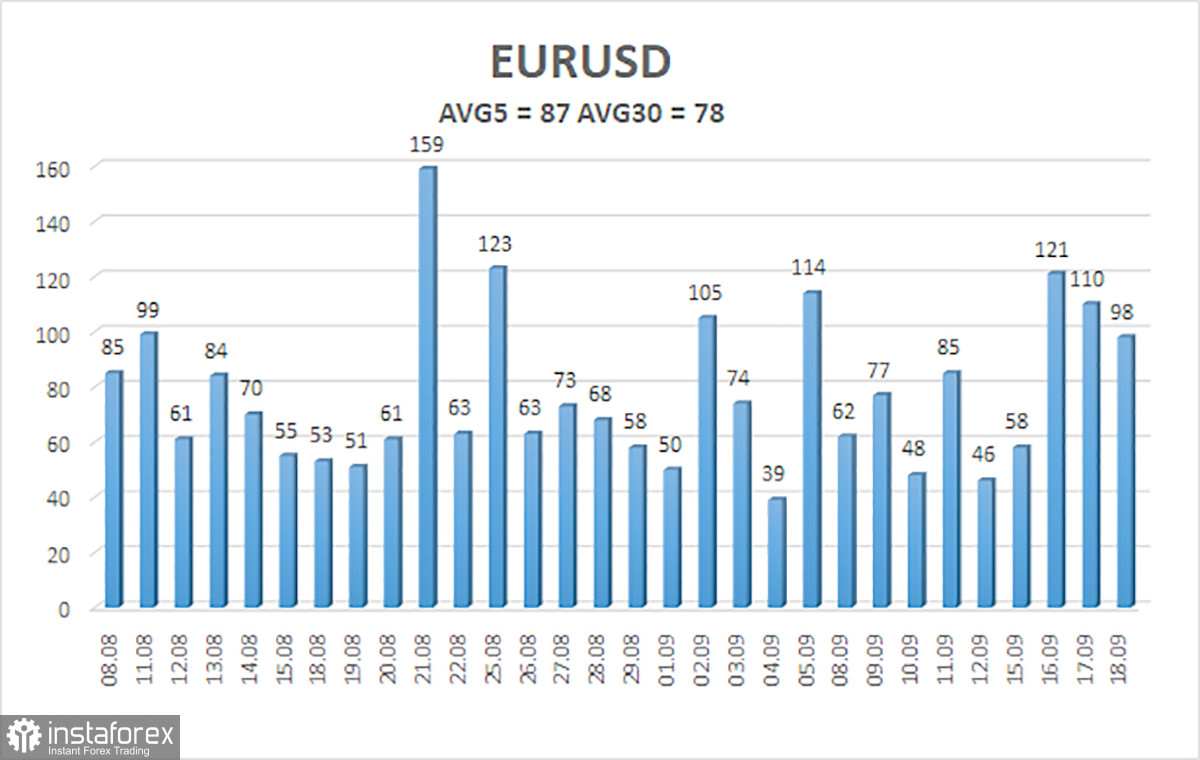
The average volatility for EUR/USD over the past five trading days as of September 19 is 87 pips, which is "average." We expect the pair to move between 1.1687 and 1.1861 on Friday. The long-term linear regression channel is pointed upward, still indicating a bullish trend. The CCI indicator has entered the oversold zone three times—warning of a trend resumption. There was also a "bullish" divergence signaling potential growth. The last time the indicator entered the overbought zone, but on an uptrend, this signals a correction.
Nearest Support Levels:
S1 – 1.1719
S2 – 1.1597
S3 – 1.1475
Nearest Resistance Levels:
R1 – 1.1841
R2 – 1.1963
Trading Recommendations:
The EUR/USD pair may resume its upward trend. The US currency is still heavily influenced by Trump's policies, and he isn't planning to "rest on his laurels." The dollar has grown as much as it could (and not for long), but now it seems time for a new extended downturn. If the price settles below the moving average, consider modest shorts targeting 1.1719 and 1.1687 on a purely corrective basis. Above the moving average, long positions remain relevant with targets of 1.1861 and 1.1963 in line with the ongoing trend.
Chart Elements Explained:
- Linear regression channels help determine the current trend. If both channels point in the same direction, the trend is strong.
- The moving average line (settings 20,0, smoothed) indicates the short-term trend and trade direction.
- Murray levels serve as target levels for moves and corrections.
- Volatility levels (red lines) are the likely price channel for the next day, based on current volatility readings.
- The CCI indicator: dips below -250 (oversold) or rises above +250 (overbought) mean a trend reversal may be near.