empty
 
 
20.10.2025 04:31 AM
EUR/USD Overview – October 20. The Pound Pulls Back but Maintains Positive Momentum

This image is no longer relevant

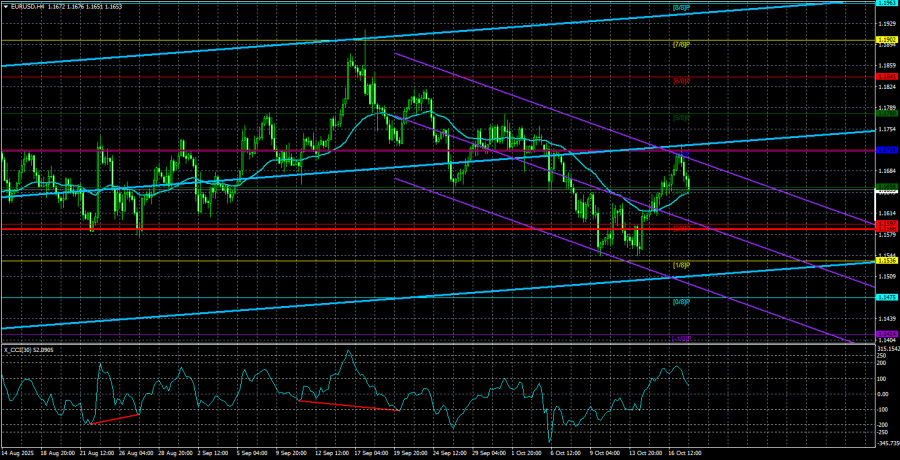
The EUR/USD currency pair experienced a relatively unexpected decline toward the moving average on Friday. From a technical standpoint, there was nothing extraordinary about this move—it was a routine correction. If sellers manage to hold the price below the moving average, the trend may shift back to bearish, though even that would likely have no long-term implications.

This is all about the daily timeframe. The "Trump Trend" began earlier this year, placing us firmly in a medium-term outlook. It's on higher timeframes like the 24-hour chart that the picture becomes clear: we are in a strong uptrend that has, over time, transitioned into a broad sideways range—or flat market. This flat phase represents an accumulation or distribution period for large players. In simpler terms, the market has been preparing for a new trend for several months already, and most of the short-term movements we're seeing are mere market noise within that broader consolidation.

It's important to remember that during flat phases, significant reasons aren't necessarily required for the price to move in either direction. Our view is that the market is currently accumulating negative factors related to the U.S. dollar, preparing to price them in all at once. At present, there is no real support for the dollar stemming from fundamental news. We don't believe the dollar's recent bullish episodes are due to the Federal Reserve's "not-too-dovish" stance or Trump's ever-changing rhetoric.

On Friday, the U.S. dollar gained modestly, and many analysts quickly pointed to "easing trade tensions" with China. But let's not forget: Trump has, in recent months, imposed a new round of tariffs—affecting goods like trucks, medical supplies, and furniture. Tariffs on Indian imports have increased to 50%, and Chinese products now face 100% tariffs. Is this what analysts call "de-escalation" or "reduced trade tension"?

Even if the U.S. and China reach another temporary agreement in November, that won't spell the end of the trade war. Next month, Trump could again declare "unfair treatment" and impose new tariffs—this cycle could continue indefinitely. Markets will continue reacting to this formidable factor. However, it's worth noting that the market moves according to defined algorithms and patterns. To initiate a new long-term trend, time is needed for institutional players to build the necessary volume. Retail traders with small positions can buy or sell quickly, but large banks and institutions can't move billions in and out of positions overnight.

Therefore, we continue to expect further weakening of the U.S. dollar. The current correction may last a few more weeks or months, but the overall outcome still looks evident.

This image is no longer relevant

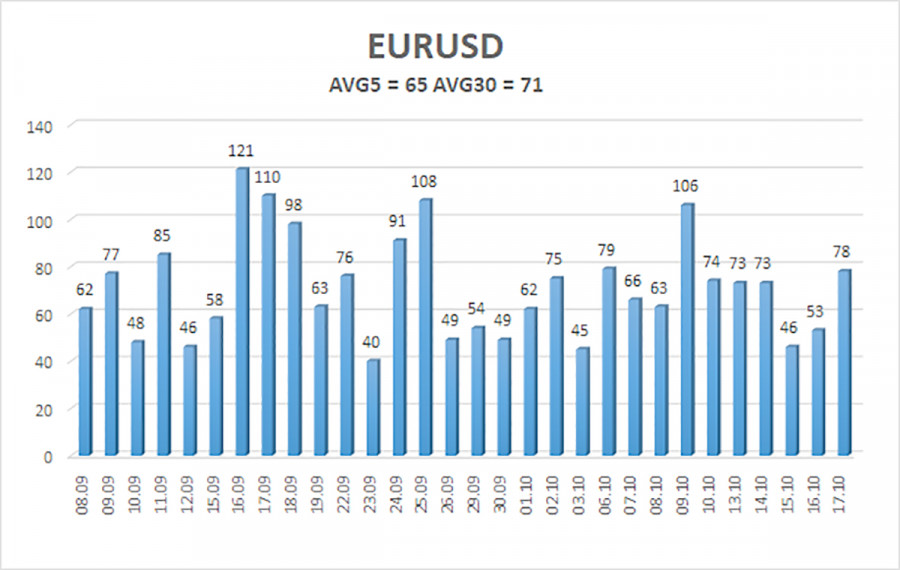
The average volatility for EUR/USD over the past five trading days stands at 65 pips as of October 20, considered "average." For Monday, we expect movement within the 1.1588 to 1.1719 range. The long-term linear regression channel remains upward-sloping, indicating that the broader trend remains intact. The CCI indicator recently entered oversold territory, which could trigger a new upward wave.

Nearest Support Levels:

  • S1: 1.1658
  • S2: 1.1597
  • S3: 1.1536

Nearest Resistance Levels:

  • R1: 1.1719
  • R2: 1.1780
  • R3: 1.1841

Trading Recommendations:

EUR/USD is attempting to establish a new uptrend on the 4-hour chart, while the longer timeframes continue to show a bullish market. U.S. dollar dynamics remain driven mainly by Donald Trump's policies and anti-global rhetoric. Although the dollar has shown short-term strength recently, these episodes are rooted in fragile reasoning. The flat movement on the daily chart fully supports this view.

If the price stays below the moving average, short-term short positions can be considered with a target near 1.1536, based purely on technical conditions. If the price remains above the moving average, long positions remain valid toward 1.1841 and possibly 1.1902 in continuation of the broader trend.

Explanation of Chart Elements:

  • Linear regression channels help identify the current trend direction. If both channels point in the same direction, the trend is considered strong.
  • The moving average line (20,0, smoothed) defines the short-term trend and the preferable direction for trading.
  • Murray levels represent projected support/resistance zones for trend continuation or correction.
  • Volatility levels (red lines) suggest the expected price range for the next 24 hours based on current volatility measures.
  • CCI indicator: values below –250 (oversold) or above +250 (overbought) signal a potential reversal or trend shift.
Ringkasan
Segera
Analitic
Stanislav Polyanskiy
Mulakan perdagangan
Jana pendapatan melalui perubahan kadar mata wang kripto dengan InstaForex.
Muat turun MetaTrader 4 dan buka dagangan pertama anda.
  • Grand Choice
    Contest by
    InstaForex
    InstaForex always strives to help you
    fulfill your biggest dreams.
    SERTAI PERADUAN
  • Chancy Deposit
    Deposit akaun anda sebanyak $3,000 dan dapatkan $1000 lebih lagi!
    Dalam Oktober kami membuat cabutan bertuah $1000 dalam Kempen Chancy Deposit!
    Dapatkan peluang untuk menang dengan membuat deposit $ 3000 ke dalam akaun dagangan. Setelah memenuhi syarat ini, anda menjadi peserta kempen.
    SERTAI PERADUAN
  • Trade Wise, Win Device
    Daftar untuk peraduan dan tambah dana akaun anda dengan sekurang-kurangnya AS$ 500 untuk layak memenangi peranti mudah alih.
    SERTAI PERADUAN
  • Bonus 100%
    Peluang istimewa anda untuk menerima bonus 100% pada deposit anda
    DAPATKAN BONUS
  • Bonus 55%
    Dapatkan bonus 55% pada setiap deposit anda
    DAPATKAN BONUS
  • Bonus 30%
    Dapatkan bonus 30% setiap kali anda membuat penambahan dana akaun anda
    DAPATKAN BONUS

Artikel yang dicadangkan

Tidak boleh bertanya sekarang?
Tanya soalan anda di Ruangan bersembang.
Panggilan semula Widget