EUR/USD Analysis on 5M Timeframe
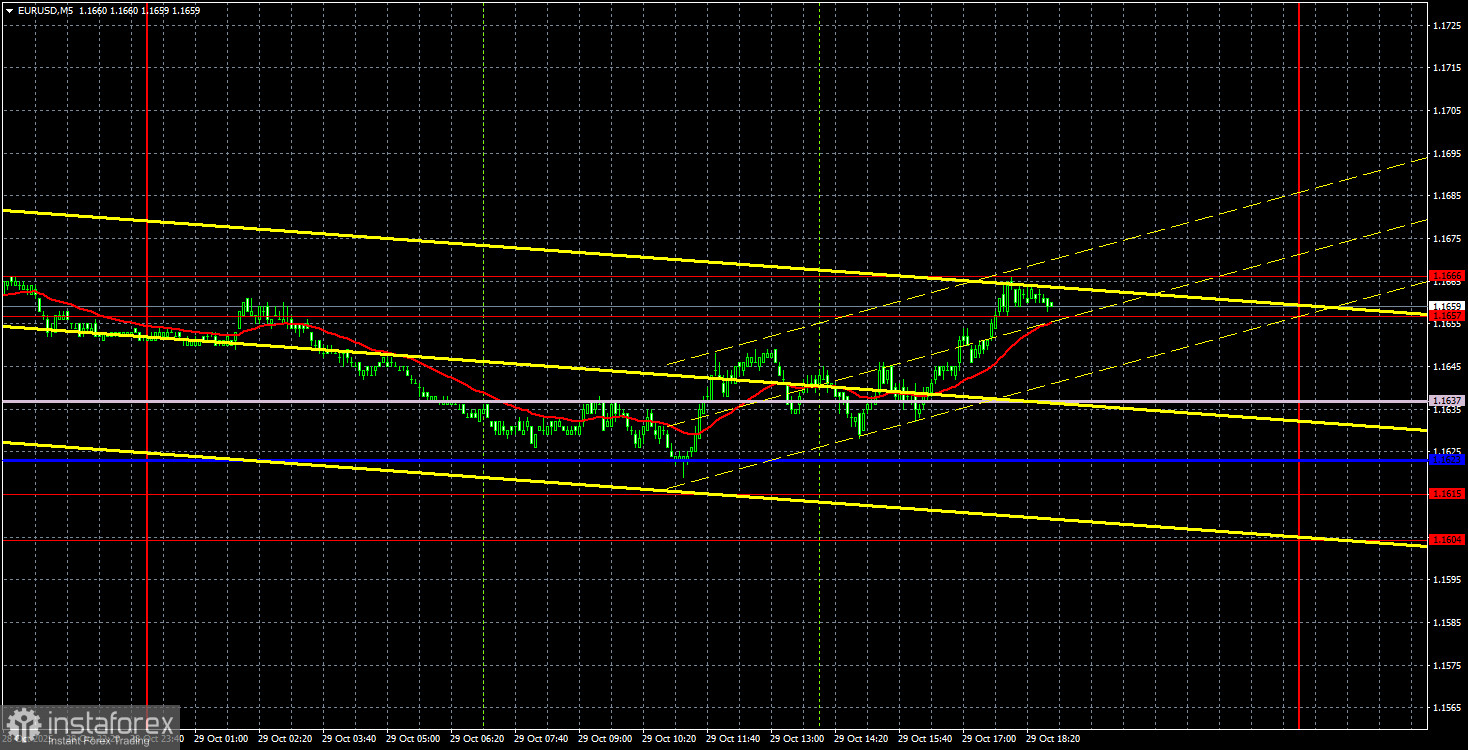
The EUR/USD currency pair continued to exhibit convulsions rather than clear movements. Switching to the 5-minute timeframe, it is evident that for almost the entire day, the price remained in the familiar range of 1.0604-1.1666, making no attempts to break free. Volatility was once again minimal, and there was a lack of macroeconomic and fundamental news throughout the day. Thus, for the third consecutive day, there is nothing to analyze.
We want to remind readers that this article does not discuss the outcomes of the FOMC meeting or the price movements that followed. We believe the market needs time to fully digest the information received. Therefore, technical and fundamental conclusions should be made during the day and not on a "hot head." It is apparent that immediately after the FOMC meeting, market volatility increased due to the onset of "emotions." However, we see no point in reacting to such price changes. Often, prices begin to jump in every direction after a central bank meeting, and trying to trade such movements is a direct path to losses.
Looking at movements on the 5-minute timeframe throughout the day, there is little to consider. In the 1.1604-1.1666 area, there are four levels and two Ichimoku indicator lines. Trading between them lacks practical value. Therefore, we believe it is necessary to wait for the price to exit the specified range. Caution is advised, as the price may "burst" out of it after the FOMC meeting, only to return the following day.
COT Report
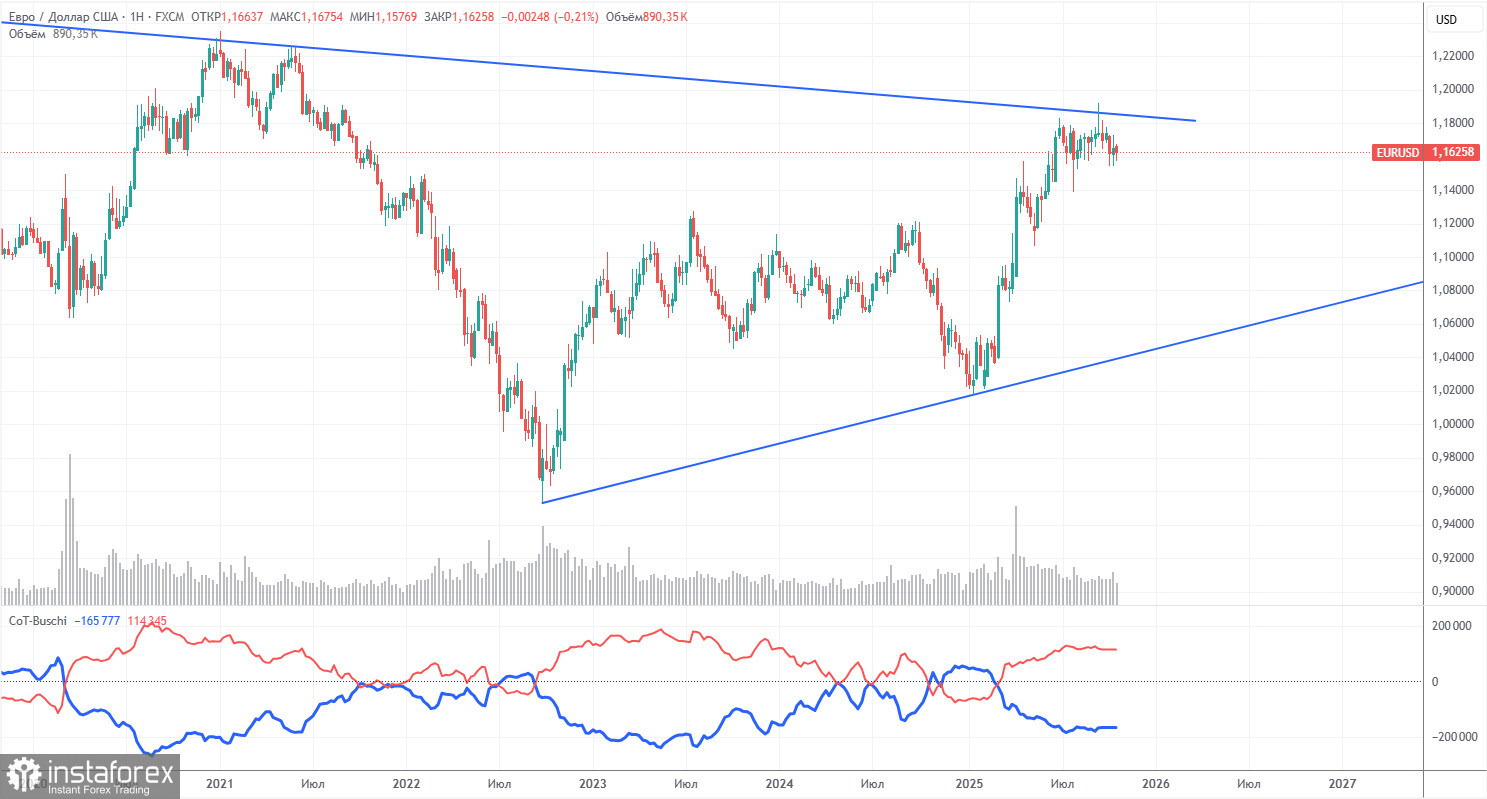
The latest COT report is dated September 23. There have been no further COT reports published since due to the US "shutdown." The illustration above clearly shows that the net position of non-commercial traders has long been "bullish," with bears struggling to regain the upper hand at the end of 2024, only to lose it quickly. Since Trump took office for a second term, the dollar has been falling. We cannot say with 100% certainty that the US currency's decline will continue, but current global developments hint at this possibility.
We still see no fundamental factors that would strengthen the euro, whereas there are sufficient factors for the dollar's decline. The global downward trend remains, but what significance does the price movement over the last 17 years hold now? Once Trump concludes his trade wars, the dollar may start to rise, but recent events have shown that the conflict will continue in one form or another. The potential loss of independence for the Federal Reserve is another significant factor putting pressure on the US currency.
The positioning of the red and blue lines of the indicator continues to indicate the preservation of a "bullish" trend. During the last reporting week, the number of longs in the "Non-commercial" group decreased by 800 while the number of shorts increased by 2,600. Consequently, the net position decreased by 3,400 contracts for the week. However, this data is already outdated and holds no significance.
EUR/USD Analysis on 1H Timeframe
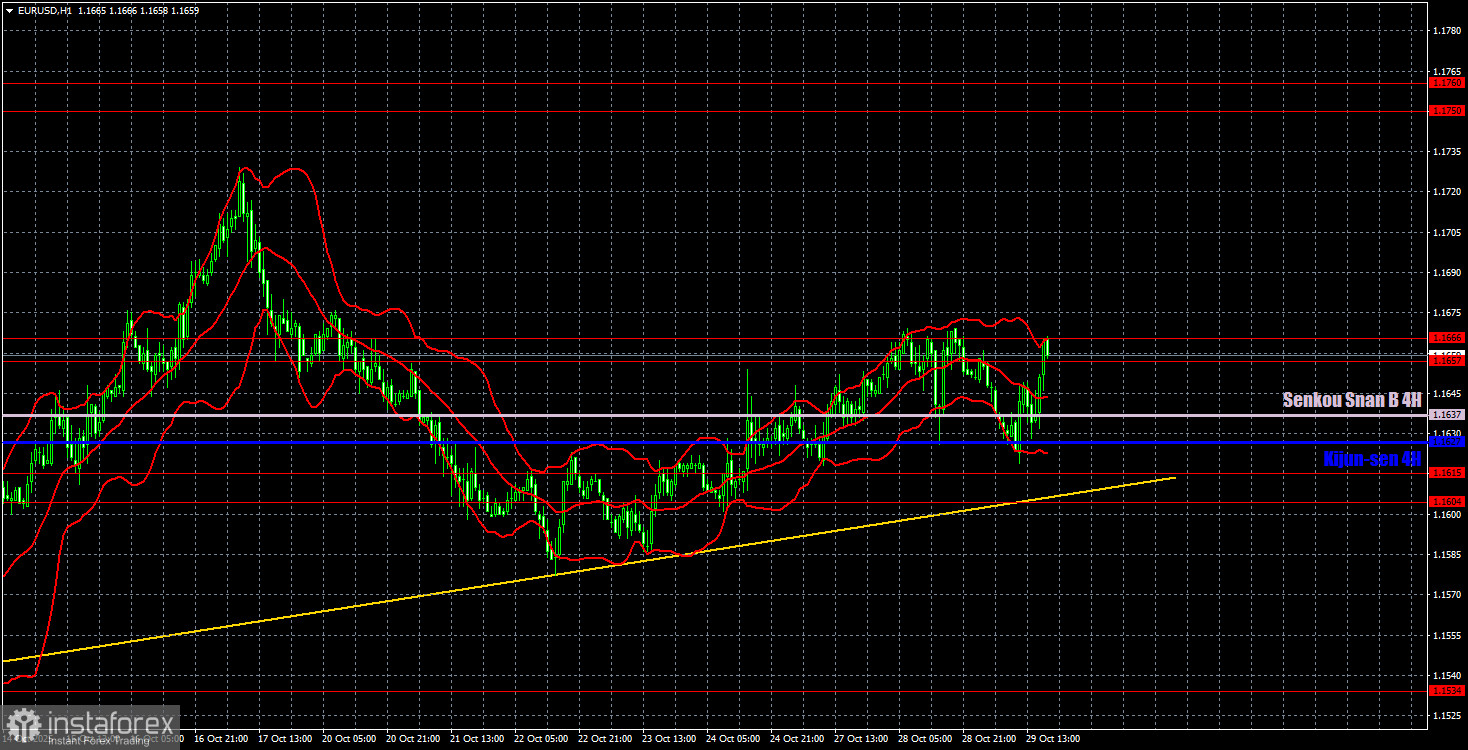
On the hourly timeframe, the EUR/USD pair could have completed its downward trend as far back as the week before last. However, recently the euro has only been declining, which remains challenging to explain outside the realm of science fiction. We believe the primary reason for the erratic, illogical movements is the flat status on the daily timeframe. This flat is still in place. In recent days, the euro has been rising, but it is yet unable to overcome the area of 1.1657-1.1666.
For October 30, we highlight the following trading levels: 1.1234, 1.1274, 1.1362, 1.1426, 1.1534, 1.1604-1.1615, 1.1657-1.1666, 1.1750-1.1760, 1.1846-1.1857, 1.1922, 1.1971-1.1988, along with the Senkou Span B line (1.1637) and Kijun-sen line (1.1627). The Ichimoku indicator lines may shift during the day, which should be taken into account when determining trading signals. Remember to set a stop-loss order to breakeven if the price moves favorably by 15 pips. This will protect against potential losses should the signal prove false.
On Thursday, a comprehensive set of macroeconomic statistics is scheduled for release in the Eurozone, coinciding with the European Central Bank meeting. In particular, unemployment, inflation, and GDP reports will be published in Germany, while GDP data will be released for the Eurozone. Plus, the ECB meeting is on the agenda. The response to these data may be weak if the ECB does not make any significant decisions, and if all reports do not show serious deviations from forecasts.
Trading Recommendations:
On Thursday, traders may trade from any area or Ichimoku indicator line of their choosing. However, we recommend waiting for the price to exit the 1.1604-1.1666 area, where there are too many levels and lines. Additionally, it is advisable to wait for the market to fully stabilize after the FOMC meeting and, preferably, after the ECB meeting.
Explanations for the Illustrations:
- Support and Resistance Levels: Thick red lines where movement may end. They do not provide trading signals.
- Kijun-sen and Senkou Span B Lines: Ichimoku indicator lines transferred to the hourly timeframe from the 4-hour. They are strong lines.
- Extreme Levels: Thin red lines where the price has previously bounced. They are sources of trading signals.
- Yellow Lines: Trend lines, trend channels, and any other technical patterns.
- Indicator 1 on COT Charts: The size of the net position of each category of traders.