EUR/USD 5M Analysis
The EUR/USD currency pair showed another session of low volatility on Wednesday. In the first half of the day, the euro declined for no apparent reason—a pattern traders have likely grown accustomed to this week. In the second half, the euro saw a sudden and somewhat unusual rise. European Central Bank President Christine Lagarde gave a speech on Wednesday, which may have sparked this unexpected movement. However, Lagarde had been speaking almost daily for the past three weeks without delivering anything new or market-moving.
Thus, we continue to consider the daily flat on the higher time frame (D1) as a key factor. It is this flat environment that contributes to the erratic, illogical moves seen in the market over the medium term. Nonetheless, the overall uptrend remains intact, and the euro could launch a new rally at any moment. We believe the market is merely accumulating negative news for the dollar, setting up a scenario where these factors are priced in collectively later as a strong bullish impulse.
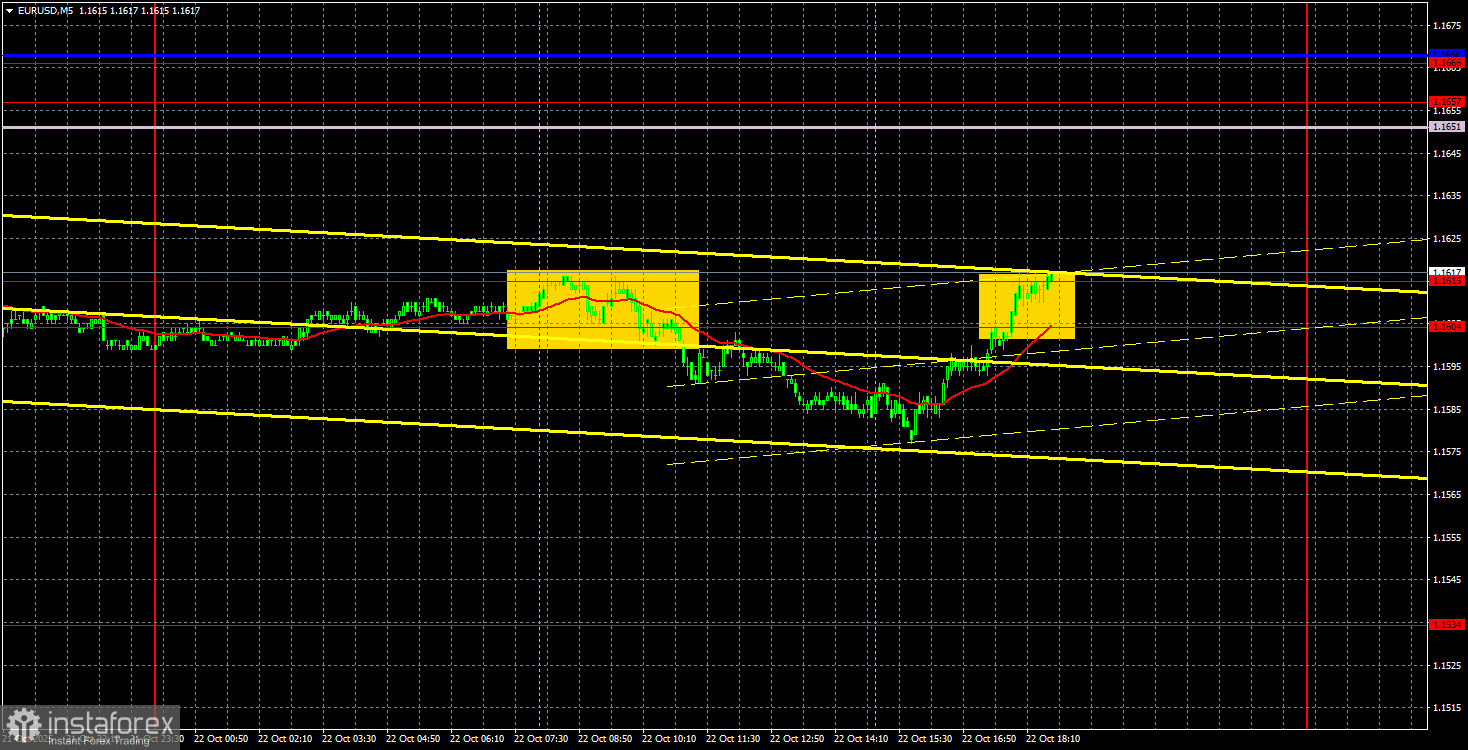
On the 5-minute chart, only one trading signal was formed yesterday. During the European session, the price rebounded from the 1.1604–1.1615 zone and moved down by about 15 pips—just enough for traders to place a Stop Loss at breakeven on short positions. Daily volatility amounted to only 40 pips. With such low volatility, expectations for intraday movement must be tempered.
COT Report
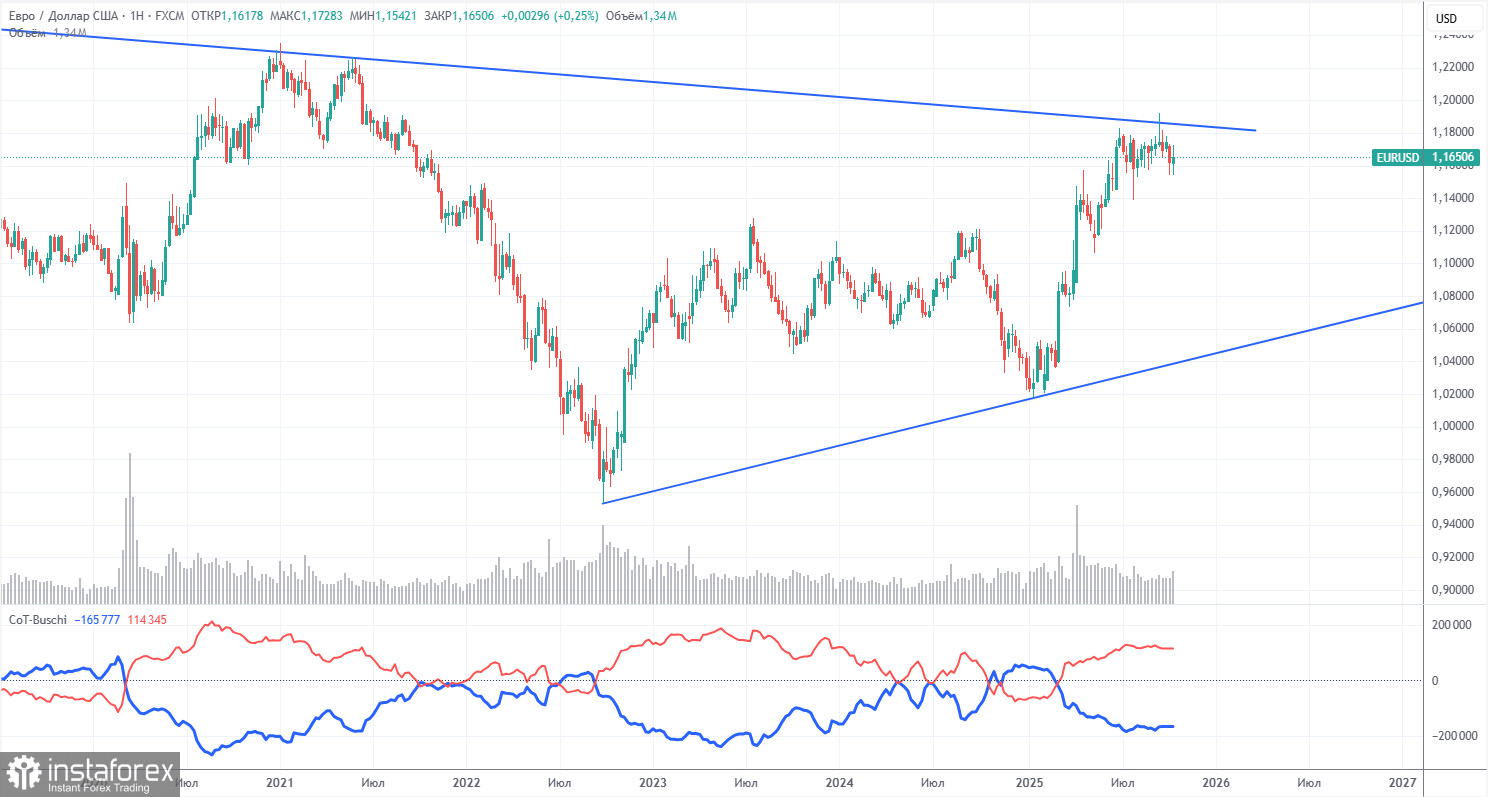
The latest Commitment of Traders (COT) report is dated September 23. No additional reports have been released since then due to the U.S. government shutdown.
As shown in the illustration above, the net position of non-commercial traders remained "bullish" for a prolonged period. Bearish traders only briefly gained control late in 2024, quickly losing it again. Since Donald Trump assumed office for a second term, the dollar has been in decline. We can't say with 100% certainty that the decline will continue, but current global developments suggest this possibility.
We still see no fundamental justification for a stronger euro, while plenty of factors continue to weigh on the U.S. dollar. The global long-term downtrend remains in play—but at this point, what meaning does a 17-year trend have? If Trump ends his trade wars, the dollar could rebound. However, recent developments suggest these tensions will persist in some form. A potential loss of Federal Reserve independence is another major pressure point for USD.
The positioning of the red and blue lines in the indicator still signals a bullish setup. In the last available reporting week, long positions in the "non-commercial" group fell by 800, while short positions rose by 2,600. Thus, net positions decreased by 3,400. However, these figures are already outdated and no longer reflect current conditions.
EUR/USD 1H Analysis
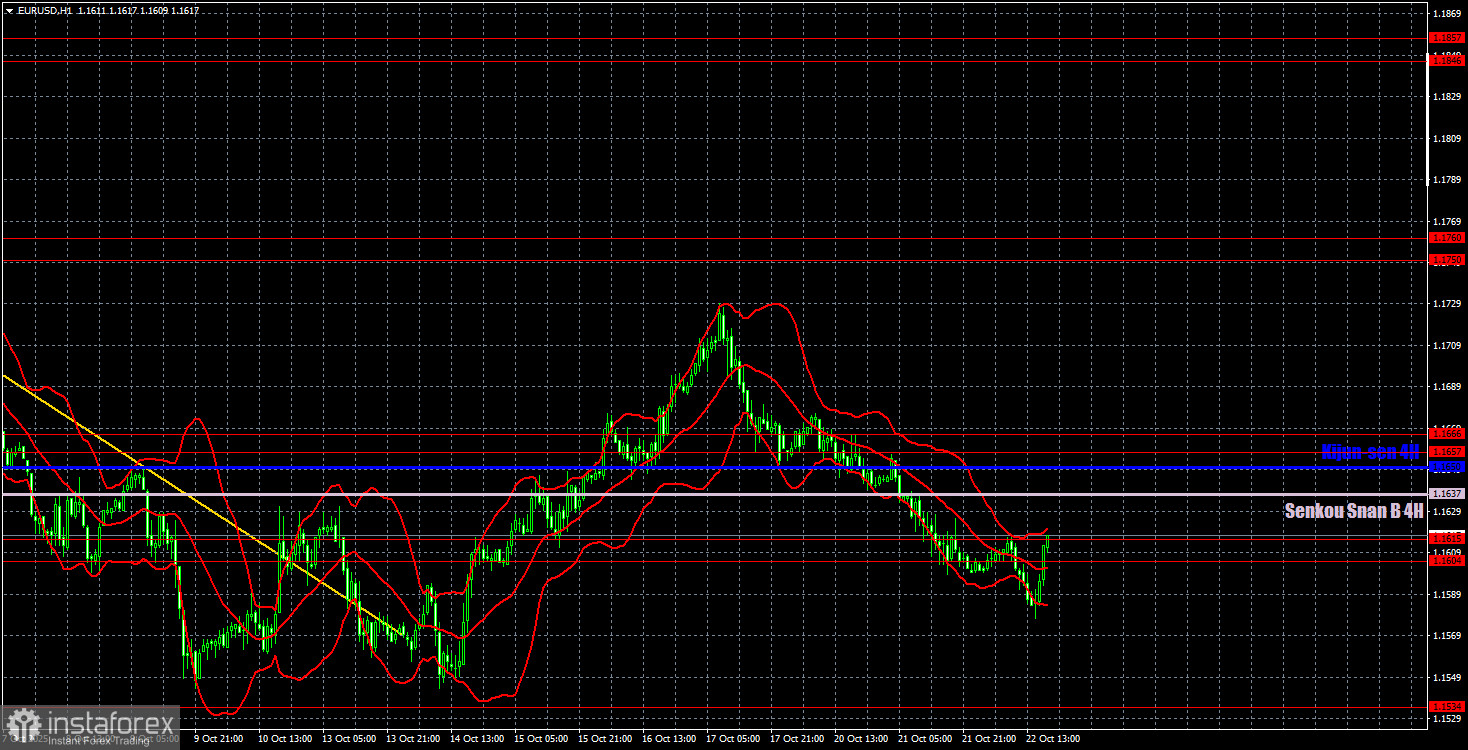
On the 1-hour time frame, EUR/USD may have completed a downward move back in the week before last. However, the euro has been steadily declining over the past several days, and it's difficult to find a logical technical or fundamental explanation—outside the flat formation noted earlier on the daily time frame.
On October 23, the key trading levels are: 1.1234, 1.1274, 1.1362, 1.1426, 1.1534, 1.1604–1.1615, 1.1657–1.1666, 1.1750–1.1760, 1.1846–1.1857, 1.1922, 1.1971–1.1988, as well as the Ichimoku indicator lines: Senkou Span B (1.1637) and Kijun-sen (1.1650). Note: during the session, these Ichimoku levels may shift; adjustments may be needed when interpreting trading signals. As always, set the Stop Loss at breakeven once the price moves 15 pips in your favor. This will protect against false signals and minimize risk.
Neither the eurozone nor the United States is scheduled to release any significant (or even secondary) economic data today. Therefore, we may see another session of low volatility and minimal movement. The broader market is largely ignoring fundamental drivers at this time.
Trading Recommendations
On Thursday, traders may once again trade from the 1.1604-1.1615 area. To open long positions with a target of 1.1657, consolidation above this area is required. Short positions can be considered if the price rebounds from below this area, with a target of 1.1534. However, volatility is likely to remain low again.
Explanation of Chart Elements:
- Thick red lines: Support and resistance levels; likely reversal zones, not direct trade signals.
- Kijun-sen and Senkou Span B lines: Transferred from the H4 Ichimoku chart to the H1 chart; strong dynamic levels.
- Thin red lines: Previous price extremums may serve as trade signal zones.
- Yellow lines: Trendlines, channels, and technical patterns.
- COT Chart Indicator #1: Represents net positioning of trader categories.